
Open PDF in Browser: Steven Ferrey,* Legal Asynchrony: Constitutional “Bridges” Inverting Elemental U.S. Technology
The 2022 Biden Inflation Reduction Act (“IRA”) and the 2021 Infrastructure Investment and Jobs Act (“IIJA”), together providing for an unprecedented $1.7 trillion in spending, were enacted to construct a sustainable legal U.S. exit ramp from what the Secretary-General of the United Nations recently described as a “highway to climate hell with our foot still on the accelerator.” This Article analyzes a critical legal missing link in these Acts that is now causing the U.S. economy to do the opposite of its intended climate change mitigation, given:
- A necessary eight-fold increase in current renewable electric power, requiring adding the entire amount of existing renewable power again every eighteen months;
- A shortage of rare-earth and critical minerals now required in quantities ten-to-fifteen times greater to produce one unit of renewable electricity compared to current power; and
- How the federal IRA plan is being legally blocked by hundreds of cities in thirty-one states, notwithstanding the Constitution’s Supremacy Clause.
The Supreme Court in 2022 announced its new “major questions doctrine” in West Virginia v. Environmental Protection Agency and applied it to limit presidential discretion regarding matters of electric power technology and climate change. States and cities are now deploying their constitutional authority, supported by Supreme Court decisions, to block a sustainable transition.
The final two Sections of this Article design an alternative sustainable legal “bridge” within existing U.S. law that does not require any congressional action and that is immediately implementable at lower cost than business-as-usual. This decentralized legal bridge also features more efficient use of energy and can be implemented immediately by local governments, state governments, and the federal government. This legal bridge can span the widening gap between these new laws’ asynchronous and rapidly increasing electric demand compared to available interconnected zero-carbon renewable power supply until these two become re-synchronized. This legal bridge sustainably operates without worsening climate change.
I. Legal Asynchrony
The Inflation Reduction Act (“IRA”) and the Infrastructure Investment and Jobs Act (“IIJA”), the major domestic achievements of the Biden Administration, rapidly accelerate a significant technology transformation in the United States, altering what some have identified as the third most important invention in history: the electric grid. Electricity is identified as the second most important invention since the wheel.[1] The marquee laws enacted by the Biden Administration are the IRA’s[2] unprecedented $369 billion, which increases to more than $1 trillion including the IIJA.[3]
Electric power now is regarded as the key economic sector contributing carbon emissions to the atmosphere, and it is rapidly changing climate. The electric sector must be successfully managed to further national and international pledges to mitigate global warming. While national U.S. law is rapidly accelerating the demand for electricity production and use, unless the law also carefully coordinates a synchronized replacement of electricity produced by combusting fossil fuels with sustainable renewable electricity, national policy exacerbates the irreversible problem of global warming. The IRA and IIJA missed several opportunities to incorporate such a legal mechanism and lack any synchronization.
This Article analyzes the critical legal missing link in the new IRA and IIJA—while the IRA and IIJA rapidly electrify every sector of the U.S. economy, they may inadvertently worsen the irreversible warming of the planet. The Acts are missing any coordination to synchronize the now evident delay in deployment of additional clean power availability with the rapid pace of greater demand for more power to electrify the entire economy. This demand for more electric power will keep existing fossil fuel power plants operating longer, warming the environment, rather than retiring as planned. Not only is there no synchronization in the IRA and IIJA of new renewable electric power deployment to be coordinated with rapid electrification, the IIJA’s failure to effectively provide for needed upgrades to electric transmission infrastructure is now forecast to be delayed and miss 80 percent of its promised potential. As reported in The New York Times in 2023, “Plans to install 3,000 acres of solar panels in Kentucky and Virginia are delayed for years. Wind farms in Minnesota and North Dakota have been abruptly canceled. And programs to encourage Massachusetts and Maine residents to adopt solar power are faltering.”[4]
The IIJA’s failure to synchronize renewable supply with this unprecedented legislative increase in electricity demand now has consumers relying on additional use of fossil fuels to generate electricity, warming the climate beyond its “tipping point.” The major questions doctrine (“MQD”), applied by the Supreme Court in West Virginia v. Environmental Protection Agency, restricts any quick executive-branch fix.[5] U.S. consumers rapidly doubling electric demand would require an eightfold increase in the current 20 percent of electric power that is now renewable.[6] To do so would require adding onto the electric grid the entire amount of renewable power in place today every eighteen months without stop for the next decade, notwithstanding that it required almost a half century since the enactment of the Public Utility Regulatory Policies Act of 1978[7] to slightly-more-than double renewable power supply during the last forty-five years.
This Article analyzes several legal challenges confronting the IRA and IIJA that create a U-turn—instead of an exit ramp—to potentially warm, rather than control, world climate.[8] Electric power is the foundation of the modern U.S. economy. All sixteen infrastructure sectors considered “critical” by the U.S. Department of Homeland Security each require reliable electric power to function.[9] Without reliable electric energy, the modern U.S. economy will not function.[10]
Additionally, this Article analyzes how stakeholders are deliberately legally frustrating the IRA’s and IIJA’s rapid transition to renewable electric power supply and energy sustainability:
- Hundreds of U.S. cities, towns, and several states, backed by Supreme Court precedent, are exercising constitutional Tenth Amendment reserved powers to block renewable power infrastructure.[11]
- Supply-chain barriers block obtaining sufficient amounts of necessary rare-earth and other key minerals, which renewable electricity uses in ten-to-fifteen times greater quantities when producing each unit compared to conventional electric power.[12]
- The majority of U.S. power generation remains generated with fossil fuels rather than renewable energy, and the new Biden laws lack certain legal “change factors.”[13]
- Analysts note that the transition to renewable energy will be delayed by the U.S. separation of powers, causing the impact on climate “tipping points” to worsen.[14]
Amid a current stalemate in Congress, an alternative mechanism is needed to compensate for the IRA’s critical omission to synchronize its shift to substantially greater use of electric power with the availability of new renewable power in lieu of more operation of existing fossil fuel-fired power. This Article’s final two sections craft a legal work-around mechanism immediately available through different levels of government to accomplish the Acts’ massive goals of electrifying the entire U.S. economy while preserving the climate. Specifically, the work-around creates a legal “bridge” within existing U.S. law, requires no additional actions of Congress or permitting delays, and avoids existing supply change blockages for critical rare earth minerals.
An energy efficiency “bridge” can serve a dual function of reducing demand for energy while delivering the same energy services and utility using significantly less energy. Energy efficiency is modular technology that can be required and/or subsidized by state, federal, or local government through various mechanisms, and it does not require delay for multi-year National Environmental Policy Act Environmental Impact Statements or new permits because it is implemented inside of existing buildings. Energy efficiency can be delivered at less cost than any other form of additional power generation and, since implemented on the customers’ side of the utility meter, can advance policies of energy equity.
There is an opportunity—and perhaps now a necessity—to deploy and utilize energy efficiency as an intermediate-term “bridge” to restrain greater demand for more fossil fuel-fired power until more renewable power resources encouraged by the IRA catch up and are in service. Energy efficiency options deliver the same energy services with less use of additional power, re-synchronizing volatile net demand with new sustainable power supply as the economy is electrified by the IRA. It may be the best and most reliable method for the United States under current policy to prevent warming the climate in the next decade past its so-called “tipping point.”
Part II addresses the climate conditions that the IRA and IIJA were enacted to protect: Nations worldwide agreed to limit global temperature increase to below 1.5 degrees Celsius with an absolute stop below 2 degrees Celsius, for which the global greenhouse gas (GHG) emissions of all countries must peak before 2025 at the latest and be reduced by a dramatic 43 percent by 2030.[15] This is a tall order since the world temperature has already risen 1.2 degrees Celsius; trying to hold it below a cumulative 1.5 degrees Celsius poses an acute challenge.[16] To have any chance of holding temperature rise to even below 2 degrees Celsius, the electric power sector is now legally required to shoulder an extremely disproportionate share of the required carbon reduction burden over the next decade. Part II of this Article analyzes what is now required by law.
This Article’s Part III examines in detail the Biden Administration’s 2022 IRA[17] and the 2021 1,039-page IIJA,[18] which collectively massively subsidized switching the entire U.S. economy to operate on electric energy within the next decade. Part III examines these laws’ rapidly expanding, often invisible, new energy-intensive demands for electricity.[19]
The IRA mandates an increase in electrical demand and provides for new renewable energy generation to meet that demand, but nothing in U.S. law provides for how this new zero-carbon supply will be linked to the increased demand. This Article’s Part IV analyzes this asynchrony’s deleterious impacts on the U.S. economy and climate pursuant to physics’ second law of thermodynamics. Nothing else in the U.S. economy is subject to—nor does any other country utilize—the uniquely bifurcated jurisdictional separation of legal power over electricity embodied for the last eighty-five years in U.S. statute and Supreme Court precedent.[20] Part IV analyzes the Supreme Court’s “bright-line” segregation of federal and state regulatory jurisdiction over U.S. power, now reshaped by the Court’s MQD in its 2022 West Virginia v. EPA decision.[21]
When demand and supply of power become asynchronous pursuant to new statutes, the electric power grid—considered the world’s single greatest engineering achievement—can collapse.[22] Part V analyzes multiple legal elements precipitating a looming deficiency of sustainable power to meet legally induced and rapidly expanding power demand:
- A federal effort to electrify most U.S. energy use in the next few years.[23]
- President Biden’s promise that by 2035 all U.S. electricity will come from zero-carbon renewable sources.[24]
- A scarcity of sufficient reasonably priced rare-earth and critical minerals for renewable electricity infrastructure as well as supply-chain challenges.[25]
- Hundreds of U.S. cities and towns as well as several states using the Constitution’s Tenth Amendment legal precedents to block the siting of the Biden renewable power infrastructure.[26]
This Article’s Part VI documents how the United States is still years away from reaching extended sustainable power capability.[27] Despite substantial increases in the last decade, only 12 percent of U.S. energy and 20 percent of electric power is now renewable, and the United States is a long way from replacing dominant fossil fuels, which still generate more than half of U.S. electric power.[28] Electric systems are complex technologies[29] and must constantly balance supply and demand every second to avoid damage to the electric system.[30] Part VI of this Article creates, for each sector of the U.S. economy, a strategic legal “bridge” over the IRA’s critical missing link to stabilize the climate, constructed with more energy-efficient technology at less cost, without changing existing law.
II. Electric Power and Climate: Joined at the Legal Hip
The world is on a “highway to climate hell with our foot still on the accelerator. . . . We are in the fight of our lives. And we are losing. Greenhouse gas emissions keep growing. Global temperatures keep rising. And our planet is fast approaching tipping points that will make climate chaos irreversible.”[31]
– U.N. Secretary-General António Guterres November 2022, Conference of the Parties 27, Egypt
U.N. Secretary-General António Guterres’s opening speech at the November 2022 27th Conference of the Parties (“COP27”) World Climate Summit in Egypt declared that the world is accelerating down the “highway to climate hell” in terms of destroying the world’s climate.[32] The world has traveled for three decades along this highway. Rather than decreasing emissions, warming has occurred.
The Paris Agreement of the United Nations Framework Convention on Climate Change (“UNFCCC”) COP in December 2015, with 186 nations of the 197 world nations attending, reached international agreement: agreement to do everything necessary to hold “the increase in the global average temperature to well below 2 degrees Celsius above pre-industrial levels” and “[to pursue] efforts to limit the temperature increase to 1.5 degrees Celsius above pre-industrial levels, recognizing that this would significantly reduce the risks and impacts of climate change.”[33] To achieve this, the world must cut its GHG emissions an additional 43 percent by 2030 to meet any of the Paris goals.[34] Instead of this substantial decrease, emissions are on track to increase by 10.6 percent by 2030, missing the reduction by huge amounts of additional warming.[35] Without an abrupt change in the energy use of all nations, temperatures will increase 1.75 to 2 degrees above historical levels by 2040. At the current business-as-usual pace, temperatures will increase by degree amounts above historical levels by 2100.[36]
The World Resource Institute found that current climate mitigation pledges by nations, if fully realized, would reduce global GHG emissions by approximately 7 percent from their 2019 levels, while a reduction of 43 percent is necessary to limit global warming to an increase of 1.5 degrees Celsius.[37] The United Nations, in its 2022 report on climate change, noted: Only 26 of 193 countries that agreed at the 2021 Glasgow COP26 conference to increase their 2015 Paris Agreement Nationally Determined Contributions of climate emission reductions have followed through with more ambitious plans.[38] The planet is on track to warm by an average of 2.1 to 2.9 degrees Celsius by 2100, compared with pre-industrial levels.[39] At this rate, the likelihood of catastrophic climate impacts significantly increases for life-threatening heat waves, food and water scarcity, and coastal flooding while millions more mammals, insects, birds, and plants will disappear.[40]
Over the course of this century, the temperature is projected by independent analyses to advance far higher than the internationally agreed maximum threshold of plus 1.5 degrees Celsius pledged by all nations at the Paris Agreement in 2015, and scientists say the likelihood of catastrophic climate impacts will significantly increase.[41] Many nations underreport their GHG emissions and exaggerate their mitigation actions, which result in data shortfalls “equivalent to between the amount of emissions produced in a year by a major industrialized nation (8.5 billion metric tons of greenhouse gases) and, on the upper end, almost a quarter of humanity’s total annual contribution to the climate crisis (13.3 billion metric tons).”[42] Oil and gas GHG emissions have been reported to be three times higher than what producers claim.[43] And fifty-two countries—more than one-quarter of all world countries—have not submitted any of their required GHG emissions inventories covering the last ten years.[44]
Notwithstanding such incomplete, exaggerated, or inaccurate data from many world nations that claim more emissions mitigation successes than have been achieved,[45] even if all announced nations’ pledges were fully realized on time, the world would still increase in temperature by at least an average of 2.1 degrees Celsius by the end of the century according to the International Energy Agency.[46] At the end of October 2022, a Wall Street Journal article concluded that even if the United States and Europe were to achieve zero-carbon emissions, the ongoing carbon-emitting activities of China and the developing world would still heat the planet.[47] Addressing climate change is about current energy consumption. More than 99 percent of GHG emissions related to electric power generation emanate from burning fossil fuels to produce power.[48] Thus, the Biden Administration is targeting electric power generation—which represents one-quarter of U.S. GHG emissions as shown in Figure 1—to shoulder a disproportionate two-thirds responsibility of reducing U.S. GHG emissions reductions.[49]
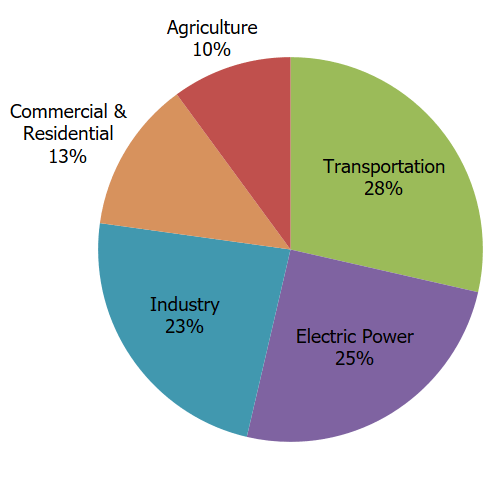
Figure 1: Total U.S. Greenhouse Gas Emissions by Sector in 2021[50]
The Department of Energy estimates that approximately two-thirds of the carbon-emissions reductions incentivized by the IRA of 2022[51] and the IIJA[52] will be in the electric power sector as shown in Figure 2.[53] This dwarfs mitigation contributions from the transportation, building-space heating, and industry sectors combined, as displayed in Figure 2. Thus, the success of national climate policy relies disproportionately on significant and rapid changes in this single sector of the U.S. economy.
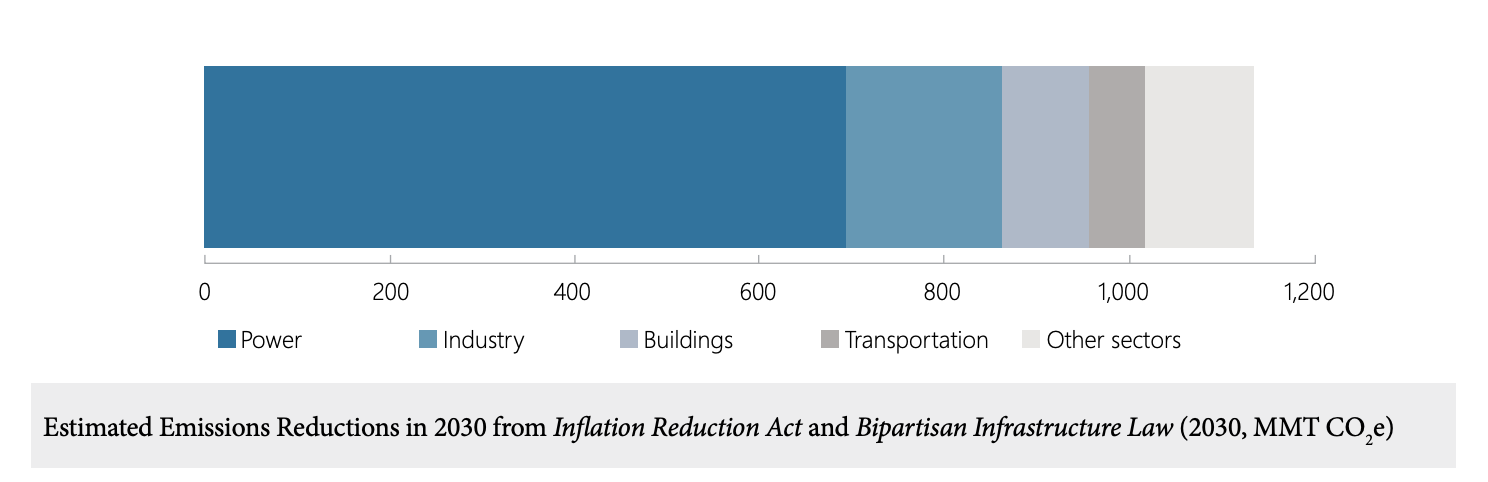 Figure 2[54]
President Biden recommitted the United States to the Paris Agreement, and in April 2021, his administration announced the new target for the country to reduce its GHG emissions by 50 percent from 2005 levels by 2030.[55] The Biden Administration pledged to replace all U.S. electric power generation now using fossil fuels with renewable energy by 2035[56] in order to fulfill the U.S. Nationally Determined Contribution to cut U.S. emissions by between 50 and 52 percent as part of the 2015 Paris Agreement.[57] While reductions of GHGs from the power sector have been one of the few U.S. reductions that exceeded expectations, even if this U.S. pledge through these 2021 and 2022 Acts is implemented perfectly and without obstacles, this only gets the United States 80 percent of the way to this current pledge to cut emissions.[58] This would still be superior to the accomplishments of most world nations.[59] These U.S. laws are dissected in the next Part. As addressed in Part V, the policy asynchrony now threatens to increase, rather than decrease, U.S. power sector climate-warming emissions.
III. The Biden Inflation Reduction Act and Infrastructure Act Electrify the Entire U.S. Economy Using Intermittent Power
Over the course of the next ten years to modernize the U.S. electric sector with renewable power generation, the IRA provides an unprecedented $369 billion for renewable energy tax credits and related investments—which both Goldman Sachs and the Brookings Institution predict will cost $1.2 trillion in lost tax credits by 2040, more than three times more than the estimates published by the federal government when the IRA was proposed and enacted a year before.[60] The IRA and IIJA are designed to reduce U.S. emissions by about 50 percent below 2005 levels by 2030, designed to achieve 100 percent carbon-free electric power nationwide (now the second-largest source of warming emissions as shown in Figure 1) by 2035, and designed to reach net-zero emissions by 2050.[61] The IIJA will replace fossil fuel-powered vehicles, including school buses, with clean, zero emission vehicles, as well as investing in a substantial network of electric-vehicle charging stations throughout the United States.[62]
In addition to addressing carbon dioxide (CO2) emissions, the Biden legislation also addresses emissions of the second-most-important emitted molecule, methane (CH4),[63] of which the Unites States emits the most of all world nations.[64] Atmospheric methane increased faster in 2021 than at any time since systematic recordkeeping began in 1983.[65] In October 2022, the World Meteorological Organization announced the largest annual surge in methane concentrations on record.[66] By slashing methane emissions, humans can avoid four times more warming by 2050 than through decarbonization alone.[67]
Section III.A below sets forth the IRA’s significant increase and extension of federal tax credits as applied to new electric power production: Tax credits that were on the verge of extinction have been extended for an additional decade at even higher amounts. Notwithstanding these added incentives, later parts of this Article will analyze why there are still significant barriers, unaddressed by the IRA and IIJA, that prevent renewable power from developing as rapidly as the new demand created by electrifying the U.S. economy.
A. Extensions of Renewable Power Tax Credits
The cornerstone of the IRA provides ten-year extensions for the two federal renewable energy tax credits at their then-current 2022 levels, which were scheduled to phase down in amount or be phased out, with some conditions:
- A Production Tax Credit (“PTC”) can be applied for power sold to third parties during the first ten years of a facility’s operation. The credit is either equal to either $0.005/kWh as a base amount or a credit for certain technologies equal to $0.003/kWh.[68]
- An Investment Tax Credit (“ITC”) of at least 26 percent of eligible capital costs.[69]
- Extension of other renewable energy tax credits.[70]
- Meeting prevailing wage amounts[71] and apprenticeship[72] provisions increase each of the PTC and ITC credits substantially.[73]
- New eligible small renewable energy facilities with a net output capacity of less than 1 MW (megawatt) automatically receive higher-value PTC and ITC credits without meeting apprenticeship and prevailing wage amounts.[74]
Through 2024, the Act provides the developer of a new renewable energy project the election of a direct payment of the ITC, which no longer requires that the developer have project tax revenue to offset the credit, or alternatively to structure tax-equity financing to immediately realize the credit.[75] These two key electric power ITC and PTC credits would phase-down once annual GHG emissions fall by at least 75 percent from 2022 levels.[76] There are significant “bonus” credits available to raise the value of each credit depending on where or with what workers, wages, and materials the projects are constructed.[77] These bonus credits also increase the value of energy-storage tax credits, as they do for solar- and wind-generation credits.[78] For the first time, the ITC can be paid as cash rather than as a tax credit for certain eligible developers, and under the IRA, the ITC becomes more easily transferable without elaborate tax-equity financing.[79]
The IRA-established, technology-neutral ITC (in Section 48D of the Tax Code) replaces the above-analyzed ITC when the latter phases out at the end of 2024.[80] This new post-2025 credit with available bonus credits can require the federal government to provide tax credits or cash of up to 60 percent of the project cost on day one. [81] These bonus credits include:
- A 10 percent credit bonus for projects located in energy communities (defined as brownfield sites or fossil fuel-host communities);[82]
- A 10 percent credit bonus for meeting domestic manufacturing requirements for steel, iron, or manufactured components;[83]
- A 10 percent bonus for projects located in low-income communities or on Tribal land;[84] and
- A 20 percent bonus for projects of less than 5 MW (megawatt) capacity located in low-income residential buildings or part of low-income economic benefit projects—with a cap on total dollar amount of gigawatt hours of capacity that will benefit from this credit.[85]
The IRA extends the PTC provided in Section 45 of the Tax Act through 2024 when it is replaced by a new, technology-neutral Clean Electricity PTC in Section 45Y of the Tax Act for projects constructed after 2024.[86] It includes similar credit bonus multipliers as for the ITC until 2024.[87]
B. State and Local Incentives
States are barring expansion of the use of fossil fuels in preference for rapid electrification for all new space heating, water heating, cooking, and other applications. Without more synchronization of new sustainable electric power generation, along with the federal incentives for electrification, will this increased electric demand outpace the supply of new renewable power? A lack of synchronizing new additional electric demand with the availability of adequate renewable resources to generate that additional demand in electric power would require the continuation of additional operation of fossil fuel-fired power generation projects that warm the climate rather than the retirement of fossil fuel generation units as planned.
1. State Incentives
States are creating technology electrification incentives as well. For example, Massachusetts is implementing plans to reduce its GHG emissions by at least 85 percent by 2050 and ultimately achieve net-zero emissions.[88] Massachusetts seeks to reach net-zero emissions by regulating GHG emissions in several ways, which are outlined in its 2050 Decarbonization Roadmap (“MA Roadmap”).[89] The MA Roadmap features a plan to transition all existing home heating from natural gas and oil heating to electric heating.[90] Combustion of fossil fuels in residential and commercial building subsectors were responsible for 27 percent of state GHG emissions in 2017; space heating was the primary contributor to emissions.[91]
To make this transition, Massachusetts’s goal is to convert 100,000 homes to electric heating per year starting in 2030, replacing traditional fossil fuel heaters with electric heat pumps.[92] By 2030, the state hopes to have converted one million homes; however, in 2020, less than 500 homes were converted to use an electric heat pump,[93] which is less than one-half of one percent of the goal. These conversions to heat pumps for existing buildings are subsidized by rebates at higher retail rates and assessed to remaining natural-gas and electric-resistant heating customers.[94]
In addition to building-space-conditioning requirements, the other major sector responsible for GHG emissions is transportation. The MA Roadmap plans to electrify public transit within the next few decades.[95] The plan will require the greater Boston subway and bus authority to electrify all buses prior to 2040.[96] To further support the state’s efforts, Massachusetts is considering imposing a carbon fee on transportation and heating fossil fuel prices.[97]
California has similar plans.[98] Implementing 2006 Assembly Bill 32, California adopted a plan to reduce GHG emissions by 40 percent below 1990 levels by 2020.[99] A 2020 California executive order announced a plan that, by 2035, all new cars and passenger trucks sold must be zero-emission vehicles.[100] California, like Massachusetts, recognized that low-carbon and carbon alternatives are likely to cause increased electricity substitution and usage as industries switch to different energy sources for heating and transportation. As a result, in 2018 California adopted Senate Bill 100, which established a goal to achieve 100 percent carbon-free electricity by 2045.[101] California also is banning the sale of gas-fired furnaces after 2030.[102]
2. Local Electrification Requirements
Cities and towns in Massachusetts and California have been the first on their coastlines to mandate additional electrification. Brookline, Massachusetts enacted a local bylaw prohibiting the installation of major appliances that require on-site fossil fuel consumption, becoming the first municipality in the Northeast to do so.[103] However, the Massachusetts Attorney General barred the bylaw, stating that it was preempted by the state building code, the state gas code, and the exclusive authority over utility issues exercised by the state Department of Public Utilities.[104] When Brookline enacted a similar subsequent bylaw a year later in 2021, it was again stricken down by the Attorney General as preempted.[105] In 2022, Brookline realized a path forward when the state legislature enacted legislation permitting the state to begin a ten-municipality pilot program allowing local prohibition of fossil fuel connections for new building construction, which included Brookline.[106]
Similarly, in 2020, Berkeley, California banned natural gas connections in new buildings, becoming the first municipality in the nation to enact such a ban.[107] This ban was upheld by a state court when challenged by commercial building operators.[108] Sixty-four other California cities and towns have since enacted similar ordinances banning natural gas use for heating.[109] A court also upheld a City of Santa Rosa, California gas-banning ordinance.[110] Moreover, the California Air Resources Board recently voted to ban the sale of gas heaters and furnaces statewide, effective in 2030.[111]
IV. The Second Law of Thermodynamics—Legal Entropy
Energy flows underlie all human activity and substantially influence both the economic and the ecological systems locally and regionally, as well as globally.[112]
Before analyzing in more detail the asynchrony in law that appears to be a major obstacle constricting the recent IRA and IIJA from achieving their objectives, it is important to understand the unique properties of electric power. It is different than all other forms of energy, and thus the law needs to comprehend and be tailored around these unique features. This Part examines the second law of thermodynamics and entropy. Greater entropy resulting from poorly designed legal changes creates a significant detriment to global climate change. With this clearly in focus, the final Part of this Article crafts a least-cost legal “bridge” to salvage the goals of recent U.S. legislation as well as a time-sensitive means to address the changing climate despite policy asynchrony.
A. Entropy
The world consumes energy at the rate of 580 million terajoules (TJ) annually, including 25,300 tWh (terawatt hours) of net electricity consumption in 2021.[113] The United States solely spent $1.3 trillion on energy in 2018, with the U.S. energy consumption currently projected to grow more than twice as fast as any other end-use sector from 2021 to 2050 as population and economic growth outweigh efficiency gains.[114] The first law of thermodynamics shows that energy can never be lost; it can only be converted from one form of energy to another form.[115] Various kinds of energy are linked, and the conversion from one energy form to another does not destroy the total amount of energy pursuant to the first law of thermodynamics.[116] Most applications of fossil fuel energy to produce electricity waste approximately 50 percent of the energy they produce.
The conversion of energy from one form to another, under the first law of thermodynamics, is always and unavoidably accompanied by loss of the utility or quality of that converted energy, according to the second law of thermodynamics.[117] Thus, under the second law of thermodynamics, the potential for useful work constantly and steadily diminishes as the form of energy is converted.[118] The degradation of useful energy is called entropy.[119] The first law of thermodynamics proves that most of our fossil fuel-produced and -consumed electric energy in the Unites States becomes low-value, high-entropy heat and thus warms our biosphere, adding to measured temperature increases.[120]
The second law of thermodynamics critically states that energy, especially to support human endeavors, is subject to ongoing entropy.[121] In a natural state, heat always moves from warm to cold, and entropy always increases as the useful nature of energy is diminished or lost, reducing energy system efficiency.[122] Converting sectors of the economy to high-value electric power to perform low-level heating and space-conditioning services will stretch and extend the continued use of fossil fuels to supply that demanded power. Before there is sufficient added renewable electric power generation capacity, pursuant to the second law of thermodynamics, conversion of substantially more fossil energy to create more electricity to be used to heat buildings will significantly increase entropy with each conversion, decreasing the end-use efficiency of fossil energy first converted to electric power and thereafter reconverted against back to heat for buildings. Each of these conversions contributes significantly to wasting higher-value energy and also causes more fossil energy to be used to produce more electricity, which additionally warms the climate.
B. The Law of Physics; The Physics of Law
The unique thermodynamic laws operating in the physical world have implications for how policymakers should most appropriately incorporate these physical realities when enacting energy and environmental laws. This incorporation of science does not always occur in the legislative process. This part of the Article highlights how U.S. law has been structured to address energy and climate. It highlights key distinctions between federal, state, and local power in the U.S. legal system.
1. U.S. Law’s Idiosyncrasy on Electric Power
The Federal Power Act of 1935 provides that the Federal Energy Regulatory Commission (“FERC”) has jurisdiction over interstate and wholesale power sales; however, its authority does not extend to “any other sale of electric energy”[123] and shall “extend only to those matters which are not subject to regulation by the States.”[124] The Supreme Court has held that Congress meant to draw a “bright line,” easily ascertained and not requiring any case-by-case analysis, between state and federal jurisdiction over electric power[125] on certain regulatory matters preempting state regulation pursuant to the Supremacy Clause of the Constitution.[126]
The federal government exercises exclusive legal authority over wholesale and interstate financial transactions in electric power[127] pursuant to the Federal Power Act,[128] as upheld by the Supreme Court.[129] In 2021, the United States’ independent power producers generated 1,918,425 gWh of electricity, representing 46.6 percent of the total electricity generation in the country, compared to 2014 when wholesale power sales were 40 percent of U.S. electricity and a 400 percent increase from two decades before.[130] FERC also exercises exclusive jurisdiction over transactions for the “transmission of electric energy in interstate commerce” and over transactions involving “all facilities for such transmission or sale of electric energy.”[131]
State regulation is exercised over all retail power transactions as well as the physical transmission facilities.[132] Under the Tenth Amendment and two centuries of federal court precedent, local governments exclusively exercise their police power over all electric facility land use and siting authority.[133] Distribution of power, as opposed to the transmission of power,[134] is regulated exclusively by the states.[135] The actual physical power generation equipment or physical transmission and distribution facilities are solely within state and local legal authority.
2. The Laws of Electricity
The electric company sends the electricity through a wire to the customer, then immediately gets the electricity back through another wire. Then (this is the brilliant part) they send it right back to the customer again. This means that the electric company can sell a customer the same batch of electricity thousands of times a day and never get caught, since very few customers take the time to examine their electricity very closely…. In fact, the last year any NEW electricity was generated was 1937.
– Dave Barry (Pulitzer Prize-winning humorist),
“What Is Electricity”[136]
Having set forth the unique separation of regulatory power over energy under U.S. law, this Section highlights how power moves and operates over time—from generation to transmission over the U.S. electric grid. Energy is a function of time, and electricity moves and is measured over time.[137] The amount of work performed by energy is the product of the force applied and the distance covered.[138] Power is the rate at which work is done, or an energy flow per unit of time.[139] Time is a key variable in electric power.
a. Volts and Power
Volts are the measure of the difference in electrical potential between two points of a conductor;[140] amperes measure the intensity of electric current.[141] The power of any electrical system is equal to the product of current and voltage.[142] One volt-ampere is equal to one watt.[143]
“The amount of energy from an electron that moves from one wire to another is the product of the electron charge times the potential difference between the wires.”[144] The potential difference is measured in volts.[145] “Transformers” take power coming in the form of a small amount of current at high-voltage, and transform it into a nearly equal amount of power at lower and less dangerous voltages with higher currents.[146] What is sold by electric utilities at one metered specification or another ultimately is energy.
The copper atoms in a wire are composed of electrons circling the protons and neutrons in the copper atom nucleus.[147] They are in close orbit around the nuclei when no electric generation is present.[148] “A conventional electric generation facility, by creating an electromagnetic field, causes the electrons in one copper atom to jump to the next copper atom, seriatim.”[149] The copper atoms and their subatomic particles remain in the wires, regardless of whether the wires are supplying power or not. Copper electrons remain in the wires whether the line is energized or not at any particular moment in time.[150] This sets up a high-velocity charged jump of electrons from atom to copper atom along the copper strand at approximately the speed of light.[151]
This constant movement causes the total number of electrons to remain constant. It is the movement of copper electrons from copper atom to atom within the electrical field that is electricity.[152] “The energy is carried by electric and magnetic fields, whose squared values give the energy density (J/m3) in space.”[153]
b. Electricity Rules
Electricity is a moving electrical charge.[154] It is the movement of that charge, not the charge itself, that provides electric energy’s ability to do work.[155] “Generating electricity does not create any electrons; the electrons that constitute usable electricity are ab initio in the copper that composes the transmission and distribution system.”[156] The quantity of copper electrons is constant and remains unchanged before, during, and after electricity is “generated.”[157]
Electricity is the potential difference in electrical charge between two atoms.[158] As electrons move through a computer,[159] microwave oven,[160] or light,[161] that movement of electrons meets resistance, which retards that movement, but in doing so translates the movement to light, heat, or mechanical function.[162] “The energy ‘used’ as resistance in the appliance is offset by a diminution of the system electromagnetic field to conserve energy.”[163] When we turn off a switch, we stop the electromagnetic field movement of electrons at the switch.
c. The Circuits
We believe that electricity exists, because the electric company keeps sending us bills for it, but we cannot figure out how it travels inside wires.
– Dave Barry (Pulitzer Prize-winning humorist)[164]
Electric circuits are a means for conveying energy from one place to another.[165] Current flows through electric circuits and is the rate of flow of electric charge from one region to another.[166] Within a circuit, electrical potential energy embodied in charged particles is transferred from its to source to its application.[167] When a conductor—such as copper—is at rest, electrons from the copper atoms are free to move randomly in all directions inside the copper wire with no directional charge inside the copper wire.[168] Since there is no net flow of charge, there is no current.[169]
All of this changes when an electric field is applied to the copper wire, causing a current which affects its negatively charged electrons.[170] “For a conductor to have a steady current, it must be part of a path that forms a closed loop.”[171] The influence that makes current flow from a lower potential to a higher potential is called “electromotive force,”[172] measured in volts or joule/coulombs.[173]
Electricity is transmitted via alternating current, where the current changes directions several times per second and electrons do not flow around a unidirectional circuit, but instead oscillate in a confined area of the copper conductor; it is the local movement itself, rather than distant electrons, that is used by the consumers.[174] No charges are consumed nor created; what is consumed as electricity is intangible energy in an electric field as electric potential. The usual unit of energy is the kilowatt hour (energy over time). One kilowatt is 1,000 W (watts) per second.[175] A watt is a joule per second.[176] A kilowatt hour is 3,600,000 J (joules).[177]
Electricity is both matter and energy.[178] It is a type of low frequency radio wave which is made of protons which have matter.[179] It moves forward at the speed of light, yet it vibrates at a frequency in the alternating current (AC) wire without flowing forwards.[180] When electricity flows through a light bulb’s filament, it creates light and heat,[181] and every atomic particle—electrons, protons, etc.—entering the light bulb is preserved.[182]
Modern physicists might assert that there is little distinction between matter and energy (E=MC2)[183] and there is little concrete difference between particles which have matter and forces which are energy.[184] Legally, there is a world of difference between state and federal jurisdiction to regulate each distinct aspect of electricity.
d. The U.S. “Grid”: The Greatest Engineering Achievement
The U.S. electric grid was first created on September 4, 1882, at 3:00 p.m.,[185] when Thomas Edison flipped the switch transmitting power to eighty customers using approximately four hundred lights at 257 Pearl Street in New York City.[186] The high-voltage electric transmission network was recognized as the most important technology engineering feat of the twentieth century.[187] The “grid” is composed not only of the approximately 7,300 power generation facilities, 167,000 miles of high-voltage power lines operating at 230 kV (kilovolts) and higher, and millions of miles of low voltage lines,[188] but also the cable to connect them with consumers, collectively operating as an energized and instantaneous network.[189]
Legally, the power grid is the network of thousands of electric generators and hundreds of millions of consumers that interconnect via a virtual electronic web, with each generator acting pursuant to legal and regulatory protocols.[190] This system must remain perfectly balanced, second by second, or the system collapses, as it did in the Northeast United States in 2003.[191]
e. Resiliency and Grid Reliability
In 2021, the U.S. agency responsible for electric grid reliability, the North American Electric Reliability Corporation, expressed concern that the shift to increased renewable energy resources had the potential to threaten grid reliability.[192] Reliability and resiliency of the U.S. electric system is challenged by significant legislated changes in what electric power and the U.S. grid will be asked to handle: a massive increase in electric demand resulting from Biden Administration electrification of the American economy in the next decade[193] and a rapidly increasing amount of power supply from less reliable intermittent sources.[194]
A risk associated with a less reliable grid is rolling loss of supply or brownouts of adequate power, as has recently impacted Texas[195] and California.[196] Outages and other significant power fluctuations cost the United States nearly $30 billion a year in lost production in 1999; $150 billion for businesses in 2015; and by 2021 increasing the cost to the U.S. economy as $169 billion annually.[197] Allowing rolling blackouts as a matter of policy is a very inefficient way to balance an electricity supply crisis. This occurred in California in 2001, ultimately leading to the recall of Governor Gray Davis and the election of Governor Arnold Schwarzenegger to replace him.[198]
Collectively, the rolling California blackouts during this California energy crisis cost Silicon Valley businesses an estimated $75 million a day; the rolling brownout in the first two weeks of January 2001 cost the state economy $2.3 billion due to production cutbacks and lost wages.[199] The twenty hours of outages are estimated to have reduced gross state output by $21.8 billion and reduced household income by $4.6 billion more.[200] In a matter of a few months, the restructured California regulatory environment created a $14 billion loss for the state purchasing power on behalf of its essentially insolvent investor-owned utilities[201] that would have to be subsidized and recouped over the following decades by California taxpayers and ratepayers.[202]
For certain industries, the cost of a one-hour blackout can be millions to billions of dollars in lost production, lost orders, or lost information.[203] The U.S. Department of Energy reports costs for power outages for communication-dependent businesses as: Cellular communications, $41,000/hr.; telephone ticket sales, $72,000/hr.; airline reservations, $90,000/hr.; credit card operations, $2.58 million/hr.; and brokerage operations, $6.48 million/hr.[204]
In the 2003 Eastern U.S. blackout, more than one hundred power plants, including twenty-two of the nation’s nuclear plants, were tripped offline.[205] Fifty million people in eight states and two Canadian provinces experienced power failure.[206] Ten major airports were shut down and seven hundred flights nationwide were cancelled.[207] Certain sewage treatment plants—which are large consumers of electric power for pumps, aerations, and settling tanks—do not function without electricity, causing fugitive sewage discharges to the environment prior to their treatment and increase in bacteria levels at discharge points.
The August 2003 Eastern U.S. blackout cost the economy as much as $6 billion.[208] New York City Comptroller Bill Thompson estimated that the twenty-nine hour August 2003 blackout cost the city more than $1 billion in perishable goods and business—a $36 million per-hour hit.[209] In addition to the comptroller’s figure, then-Mayor Michael Bloomberg estimated $40 million in lost tax revenue and $10 million in overtime pay for city workers, including extra police officers on patrol and sanitation crews that worked through the weekend to pick up spoiled food.[210] The blackout cost the city’s 22,000 eateries alone between $75 million to $100 million in wasted food and lost business, the New York State Restaurant Association calculated.[211] Some people were without drinking water and 350,000 people were stranded on the New York City subway when the power went out with nineteen trains in underwater tunnels at the time.[212]
The cost of the 2003 blackout just in Ohio was estimated at $1.08 billion by the Ohio Manufacturers Association.[213] The blackout cost Michigan about $1 billion, according to then-Governor Jennifer Granholm.[214] More than seventy manufacturing companies shut down, and state and local authorities spent about $20 million on emergency services.[215] The blackout also shut down water and sewage systems in Ohio, creating public health hazards for millions of people.[216] Ohio’s electric-powered pumping stations were unable to lift water out of Lake Erie, causing all residents to have to boil their water.[217]
In Texas, a winter storm in February 2021 caused a loss of electricity to 69 percent of consumers, who were without power and water for days, causing water pipes to burst and city water-delivery systems to be unable to operate without electricity for pumps.[218] This killed hundreds of people and cost the city hundreds of billions of dollars in damages.[219] It is unclear whether Texas’s grid can be upgraded in time to support the greatly multiplied use of electricity sought by the Biden Administration to address world climate.[220]
V. State and Local Law Now Frustrate Federal Renewable Energy Policy
Both the supply of net-zero-carbon renewable electric energy supply and the rapidly multiplying demand for more electricity—fostered by electrification of building heating, transportation, and the proliferation of new wasteful energy-intensive demands for electricity for duplicativeuses—must be carefully synchronized to balance the grid every minute in a manner that actually reduces, instead of increases, GHG emissions. If the power demand advances quickly beyond the available renewable energy supply, sustainable power supply will not yet be sufficient to balance this increasing demand and will exacerbate near-term climate warming. Thus, quick integration of policies is necessary to diminish entropy and control the warming climate as analyzed in the next Sections V.A and V.B.
A. Tenth Amendment Obstacle: State and Local Legal Frustration of Necessary Renewable Energy Infrastructure
The critical legal issues include how much land is involved and what level of the U.S. federalist legal system—state, local, or federal—controls land use on land that must host sustainable energy infrastructure? The recently enacted IRA and IIJA did not anticipate nor navigate around the Tenth Amendment delegation to local and state authority regarding renewable energy and its transmission infrastructure:
- A 2022 study identified 121 local policies restricting new sustainable wind and solar projects in thirty-one states.[221]
- An article in Forbes documents more than 300 recent local decisions across the United States blocking wind projects.[222]
- All cities and towns have constitutionally reserved power unilaterally to block the siting of new renewable energy projects addressing climate warming.[223]
- States exercise exclusive power to block, and several are blocking, needed new transmission lines to transmit and carry renewable electricity to consumers for use.[224]
Notwithstanding the unprecedented generous subsidies dispersed circa 2023 and through the IRA, the fundamental structure of U.S. law featuring a federalist allocation of power among levels of government provides 35,000 separate U.S. cities and towns absolute discretion over land use.[225] With this, cities and states control whether sustainable infrastructure is sited on their land.[226] Hundreds and perhaps thousands of cities and towns already are deploying aesthetic local zoning to block renewable electric power on their land.[227]
This state and local control over U.S. land use is the critical hurdle impacting a successful transition to renewable solar and wind power, which requires much more land—up to 1,000 percent more land—than conventional power generation to produce an equivalent amount of electric power.[228] Wind turbines require an average of five-to-ten times as much land area as fossil fuel-fired power plants to produce a similar electric power output:[229] “For the energy they produce, wind turbines have a disproportionately large footprint on land. At 72.1 kM2/tW (square kilometers per terawatt), wind’s footprint is bigger than natural gas, coal, or petroleum (at 18.6, 9.7, and 44.7 kM2/tW, respectively).”[230] Another study determined that the comparative footprint for production of electricity by renewable wind, hydro, and conventional solar generation requires more land compared to fossil and nuclear power generation.[231]
There is historical precedent for population centers consuming energy far beyond their much larger surrounding geographical footprints. Because of the inefficient use of wood and charcoal for fuel, the higher density of sustainable forest growth in temperate climates was typically 1 to 2 percent more in pre-industrial times compared to the density of energy consumption in urban areas.[232] This meant that cities required the use of surrounding areas of fifty-to-one-hundred times their city area to produce enough wood to satisfy thermal requirements for domestic and primitive industrial purposes.[233] Thus, the reliance on wood fuel stripped the biomass resources of a large surrounding land area encircling cities.
Modern wind turbine power generation must occupy more land area than other technologies because wind turbines operate for less than half of the hours in a year, only being able to operate when wind speed is sufficient. U.S. wind turbine capacity factors (the percentage of the potential output due to fluctuating wind speeds) range from 0.26 to 0.52 of full twenty-four-hour, seven-days-per-week generation capacity; the average 2018 capacity factor for projects built between 2014 and 2017 was 41.9 percent; the fleetwide average capacity factor was 35 percent.[234] Such intermittent power generation at low-capacity factors needs to occupy additional land to match the power output of hydroelectric, nuclear, or fossil fuel-fired power generation which can operate constantly.[235] Fixed solar photovoltaic power enjoys even lower capacity factors than wind power and requires even more land.[236]
U.S. Supreme Court precedent established that state and local government retain “traditional and primary power over land and water use.”[237] Land-use control is predominately a local, rather than federal or state, exercise of legal jurisdiction.[238] Local land-use regulation enjoys broad court deference whenever there is any rational purpose supporting the enactment of the local ordinance.[239] This is because a “local board of appeals brings to the matter an intimate understanding of the immediate circumstances, of local conditions, and of the background and purposes of the entire by-law.”[240] The most recent Supreme Court decision on authority over land use, Murr v. Wisconsin, deferred to local judgement on the enforcement and interpretation of local zoning laws regulating new construction.[241]
Government agency rejections or withdrawals of permit applications for proposed large solar projects in 2021 occurred in Pennsylvania,[242] Montana,[243] Nevada,[244] Wisconsin,[245] and Virginia.[246] A 2022 study identified 121 local policies restricting new wind and solar projects in 31 different states, as well as 204 renewable energy projects that were contested in 49 of the 50 states.[247] The most recent opinion of the Supreme Court regarding state and local land-use zoning, Virginia Uranium v. Warren, defers to state law to control construction permits[248] and held that construction permits are not otherwise subject to federal preemption.[249]
The lines, poles, transformers, and protective equipment—the physical hardware assets necessary to serve consumers—are not included within the allocation of federal jurisdiction under the Federal Power Act.[250] This hardware and its siting on U.S. land remains within exclusive state or local authority, and numerous states have used this power to block interstate transmission lines coming through their states to serve other states.[251]
Refocusing on the new statutes, the IIJA[252] attempts to amend the Federal Power Act’s Section 216 to provide occasional federal FERC authority in limited cases (for national interest transmission corridors) to preempt long-standing state ability to refuse permits for transmission lines.[253] There is no new federal authority included in the IIJA for any federal agency to grant transmission line rights-of-way over state-owned or -controlled land. Every state owns the bottoms of all navigable waters, including riverbeds that form the boundaries of most states, as well as vast amounts of land in state parks and forests, underneath the interstate highway system, and pursuant to state conservation easements and preservation programs.[254] Thus, a new—or even upgraded and reconductored—transmission system will require accessing these state-controlled rights-of-way and land through obtaining discretionary state permits. This reserved plenary Tenth Amendment authority permits a state to block siting or upgrading a transmission line in or through its state—a line which may be needed to transmit renewable or other power to adjacent states will need to traverse state boundary rivers which are state land.
The Supreme Court in 2022 also handcuffed federal agency authority over energy by applying the newly adopted major questions doctrine (“MQD”). In West Virginia v. EPA, the Court restricted federal regulatory power over electric power and increased dramatically the power of the twenty plaintiff states’ regulation of electric power.[255] The concurring opinion by Justice Neil Gorsuch, joined by Justice Samuel Alito, reinforces state “sovereign immunity” to make these electric power operating decisions that cannot be abrogated by the federal government through “unintentional, oblique, or otherwise unlikely . . . intrusions on state interests” without a clear statement by Congress.[256] Factors announced by the Court in the few MQD opinions to date indicate that a major question is determined by the political significance of, or political controversy surrounding, an agency policy; whether that policy is a diversion from normal policy or scope of exercised authority; and whether there are other agency policies that might be supported by statutory rationale affecting the acting agency.[257] In West Virginia, the Court explained that the agency’s assertion of authority “allowed it to adopt a regulatory program that Congress had conspicuously and repeatedly declined to enact itself” and declared that “precedent counsels skepticism toward EPA’s claim” that the statutory provision authorizes it to adopt and require “a generation shifting approach.”[258]
The MQD is the most recent progeny of the recognized nondelegation doctrine.[259] Before West Virginia, the Supreme Court had only twice enforced the nondelegation doctrine that forbids federal agencies from exercising authority beyond the scope of jurisdiction that agencies were granted by Congress.[260] The MQD appeared in a 2021 case challenging the Centers for Disease Control and Prevention (CDC)’s moratorium on evictions in response to the COVID-19 pandemic, which the Court struck down because the CDC did not have jurisdiction over such landlord-tenant policy.[261] The Court in that case cited the 2014 Utility Air Regulatory Group v. Environmental Protection Agency decision and stated, “We expect Congress to speak clearly when authorizing an agency to exercise powers of “vast ‘economic and political significance.’”[262]
In 2022, the MQD resurfaced in litigation challenging the U.S. Department of Labor Occupational Safety and Health Administration (OSHA)’s emergency temporary standard issued in response to the COVID-19 pandemic. The standard required indoor workplaces with more than one hundred employees to adopt a COVID testing and masking regimen, or, alternatively, to establish a COVID vaccination requirement.[263] The Court stayed the OSHA regulation, and both the per curiam majority opinion and Justice Gorsuch’s concurrence relied significantly on the MQD, stating that the OSHA statute unambiguously foreclosed OSHA’s interpretation that it had authority over health or vaccination standards.[264]
The Tenth Amendment of the Constitution reserves residual power to be retained by hundreds of cities and states over what can be sited on their land; this residual power now is effectively being used to block renewable electric power and its infrastructure.[265]
B. Supply Chain Redux Blockage of Sustainable Policy
In addition to the legal governance impediment to the federal government preempting land use decisions, there are physical supply-chain impediments to sufficient critical minerals necessary to generate and transmit renewable power. Together, these can combine to retard the advancement of renewable power development on a pace sufficient to satisfy electrification of the U.S. economy. This creates an asynchrony in the immediate future to decrease, rather than increase, climate-warming emissions.
1. Rare-Earth, Critical Minerals
In addition to state and local law controlling the actual siting or banning of sustainable power production, recently U.S. law has not demonstrated capabilities to lubricate the physical supply chain. Assuming that renewable zero-carbon power is sited and built, for every unit of renewable energy feeding power supply, that solar energy generation requires and consumes 1,000 percent more rare-earth and other limited critical minerals than used in conventional power generation.[266]
Key minerals, in limited supply, are required in substantially greater amounts for renewable energy technologies and for renewable power battery storage than for conventional power generation.[267] In terms of weight of critical minerals per unit of generating electric capacity, wind power and solar power require much larger consumption of expensive copper, zinc, manganese, cobalt, and rare-earth minerals than do conventional fossil fuel and nuclear power generation facilities: a 1,500 percent increase of key minerals utilized by offshore wind; and for solar, 1,000 percent more than for natural gas generation.[268]
It is challenging to find new deposits of significant size in the United States of certain critical minerals for renewable energy, such as copper, nickel, cobalt, and other rare-earth minerals. Even if identified, it is difficult to get their mining permitted by various government authorities.[269] This can create a significant supply-chain bottleneck to the United States’ planned rapid transition to renewable energy. Production and control of key minerals for a renewable future are concentrated outside of the United States and often in countries with whom the United States has strained international relations, as shown in the list presented below.[270] Of note is China’s total dominance of processing all key minerals and rare earths, as well as the non-North American location of places of extraction being very concentrated in single countries outside of the North American hemisphere.[271]
| Table: Critical Minerals and Where They Are Produced[272] | |||
| Mineral | Major Country | Extraction % | Processing % |
| Copper | Chile | 40% | China 40% |
| Nickel | Indonesia | 40% | China 35% |
| Cobalt | Congo | 70% | China 65% |
| Lithium | Australia | 50% | China 60% |
| Rare Earths | China | 60% | China 85% |
Notwithstanding the hoped-for rapid expansion of renewable energy underwritten by the IRA,[273] the number of countries controlling critical minerals necessary to expand renewable energy and transmission infrastructure is projected by the International Energy Agency (“IEA”) to stay stagnant in the near-term six-year period.[274] Supply chain constraints on access to additional critical minerals could be mitigated by reclaiming or recycling supply. However, less than 1 percent of lithium and rare-earth minerals have been recycled, and other key metals, with the exception of nickel, are recycled or reclaimed at a rate of less than 50 percent.[275]
The price over the last decade of these critical metals that are necessary for an expansion of renewable energy and a significant upgrade of transmission infrastructure have been as volatile as oil and natural gas prices, garnering constant media attention.[276] For example, lithium—necessary for batteries to store intermittent wind and solar power—experienced volatility of its price exceeding 75 percent during this period.[277]
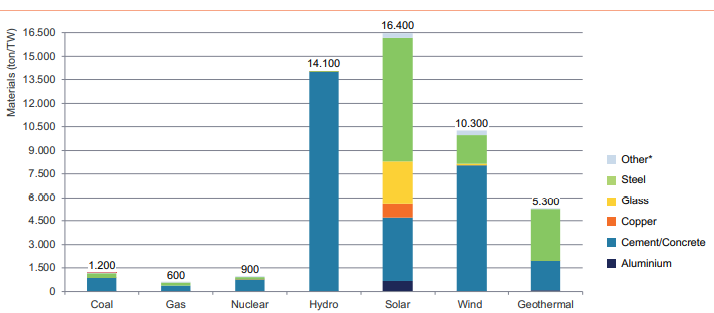 Demand for the critical metals to support renewable energy is forecasted to increase dramatically in the next two decades. The primary fossil sources of power generation—coal and natural gas—use only about 4–12 percent of the amount of critical copper, steel, aluminum, glass, and cement as do solar, wind, or hydroelectric power producing an equivalent quantity of power.[278] The amount of metal, glass, and cement used is 800–2,500 percent greater for these renewable technologies per unit of electricity generated than for conventional coal- or natural gas-fired power generation.[279]
Figure 3: Base Material of Input per 1 Tw of Power Generation[280]
In addition to the significant increased need for key minerals for renewable power generation, the commensurate need to increase the transmission and distribution infrastructure to move this power to consumers also demands substantial increases of copper and aluminum wires over the next two decades.[281] An IEA study determined that the demand for critical minerals necessary for both expanded renewable power generation technologies and for expansion of transmission lines to move it will require almost 3,000 percent more critical minerals by 2040 than currently mined and processed worldwide, while supplies of lithium and nickel must increase in the next two decades by 4,000 percent.[282] “A typical electric car requires six times the critical minerals inputs of a conventional car, and an onshore wind plant requires nine times more mineral resources than a gas-fired power plant,” according to the IEA in 2022.[283]
2. Electric Vehicles
In addition to uses such as heat supply, electric vehicles (“EVs”) also demand huge amounts of critical minerals for their batteries and electric circuitry, adding strain to an already competitive market.[284] Transportation is the largest source of climate pollution in the United States, accounting for 27 percent of the country’s GHG emissions, as shown in Figure 1.[285] The U.S. Department of Energy expects world energy demand to grow by 50 percent between 2020 and 2050,[286] while others note that the U.S. electric generation capacity will need to double if two-thirds of all U.S. cars are EVs by 2050.[287]
EVs and their on-board battery requirements already face availability issues at competitive prices to obtain sufficient rare-earth minerals for their large batteries.[288] It requires half-a-million pounds of mined minerals to produce a 1,000-pound EV battery. This added one thousand pounds of vehicle weight replaces eighty pounds of gasoline in a conventional vehicle, which itself contained 5,000 percent of the energy of a battery of the same weight.[289] The United States currently lacks a strong battery supply chain, relying largely on other countries’ extraction and manufacturing capabilities.[290] The processing of four critical minerals, including lithium and rare-earth minerals for EVs and their batteries, now is largely controlled by China, which processes between approximately 40 and 90 percent of each of these essential chemicals.[291] Despite the discovery of lithium in Nevada, it is forecast that it now takes “10 years-plus to finance and build a lithium mine.[292]
EVs require almost ten times the amount of critical minerals and metals as do conventional gasoline- and diesel-powered vehicles.[293] These rare earths and critical minerals include significant amounts of copper, lithium, nickel, zinc, graphite, and cobalt—which are sourced from a very limited number of countries other than the United States.[294] Not only are critical minerals more utilized to transition to renewable power, those minerals are largely sourced from, processed in, and controlled by foreign countries rather than the United States.
C. Asynchronous Power Demand Expansion Not Linked with Clean Electricity Supply
For the last fifteen years, electricity use in the United States has declined.[295] Even before the dramatic increase in electrification that will be caused by the 2021 IIJA and the 2022 IRA,[296] the high-electrification scenario developed by the U.S. National Renewable Energy Laboratory predicts that U.S. annual electricity consumption will increase by a factor of 1.6 by 2050 relative to the 2018 pre-pandemic level of approximately 4,000 annual tWh (terawatt-hours).[297] Since this study, the IIJA and IRA were enacted—along with the electrification requirements examined above—in several states and cities. These legal changes dramatically accelerate the substitution of large demand for electric power in lieu of traditional direct combustion of fossil fuels for heating and vehicles.[298]
During the last decade, scholars and policymakers have debated if and how soon renewable energy will supplant existing conventional power supply. Professor Mark Jacobson at Stanford argued in 2015 that between 2050 and 2055, the United States could be entirely powered by zero-carbon resources, renewable power, and storage with zero use of fossil fuels or nuclear power.[299] Jacobson’s work proposed to move massive amounts of solar and wind power across the United States to compensate for regional solar and wind intermittency.[300]
Professor Jacobson’s work drew dissent and criticism.[301] A group of prominent climate scientists countered that the Jacobson study used inadequately supported projections and contained modeling errors.[302] They noted that, with large amounts of intermittent renewable energy, there can be grid destabilization.[303] In response, Jacobson refuted these criticisms by saying that there could instead be a massive increase in interconnective electric transmission to link more sources of renewable generation[304] and sued his critics for defamation, later dropping his defamation suit in late 2018.[305] Such an upgrading of transmission infrastructure is not within federal power under U.S. law.
The IRA and IIJA aim to implement an all-renewable power system by 2035, as promised by President Biden.[306] One article displays the Jacobson scenario as to how power generation changes to reach all renewables from 2035 to 2050, where:
- Solar and wind power would replace almost all fossil and nuclear generation; and
- Energy efficiency would be responsible for less than 7 percent of the changes to eliminate reliance on fossil fuels and nuclear power as solar and wind replace all power.[307]
According to the study by Jacobson, if the United States were to use wind to generate 50 percent of energy; solar to generate 38 percent; and a combination of hydro, geothermal, and other renewable sources for the remainder, all energy could be supplied in the United States at a lower cost than fossil fuels by 2050.[308] With 2035 less than a dozen years away, the question now is how the two new laws coordinate the phase-out of fossil fuel power and their replacement with renewable power. Renewable electric power supply is not synchronized with the regulatorily mandated and growing demand for power by the IIJA and IRA. The current, although changing, reality is that renewable energy today generates only approximately 20 percent of U.S. power generation.[309]
Expanding the energy analysis beyond electricity to include transportation and other current energy uses, Figure 10 shows the sources of all U.S. primary current energy consumption, with only 12 percent of the total derived from renewable energy (including hydropower), with fossil fuels comprising almost 80 percent of total energy use and more than 60 percent of electric power generation.[310]
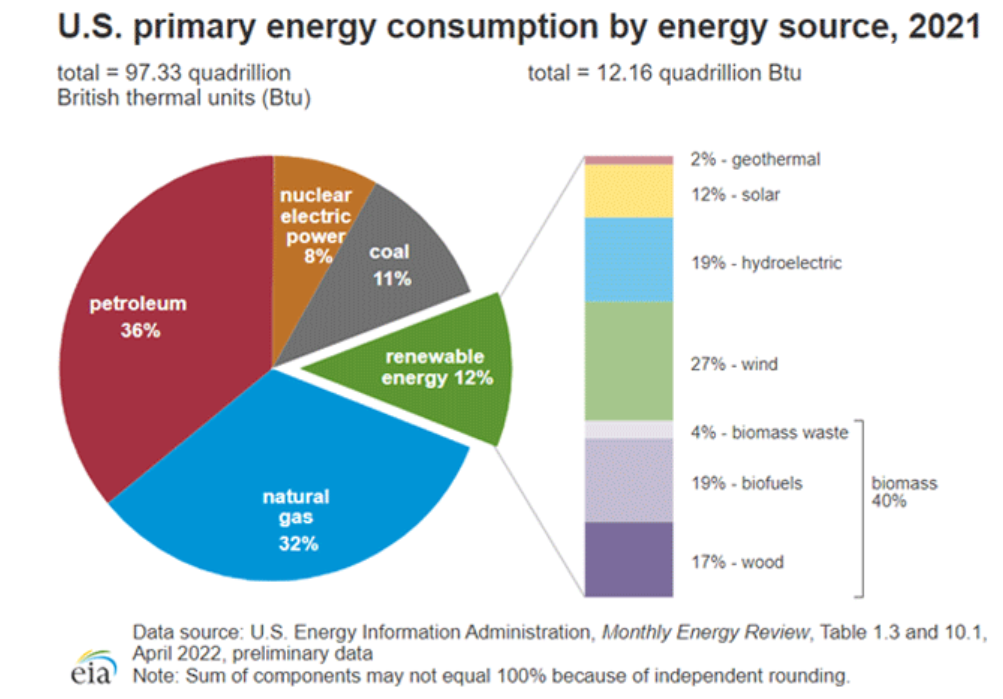 Figure 4[311]
In July 2021, the IEA concluded that sustainable energy resources will not be able to meet this rapidly expanding near-term demand for power: “[R]enewables are expected to be able to serve only around half of the projected growth in global [electricity] demand in 2021 and 2022.”[312] The IEA concluded that, even if somehow wind and solar were to fulfill all future increases in primary energy demand for the next thirty years and beyond, the world would continue to depend on conventional energy resources for a large portion of global energy needs.[313]
Unless the legal and the physical obstacles analyzed above are circumvented, a significant set of legal obstacles are now present. First, the upcoming reversal of recent power demand will occur rapidly. This is inevitable with the electrification of the American economy by federal laws, the IIJA and IRA, and is augmented by added electrification for heating and cooking under some state and local laws. It appears that this electrification will occur before a commensurate transition to sufficient renewable and zero-carbon electric power generation is sited and interconnected on the supply side, transmission infrastructure is upgraded, and this renewable energy is available.
Without and until all of this infrastructure is in place, rapidly increasing electric demand will not be satisfied by new renewable energy supply. Since utilities are required to serve all consumer demand for power, this new legislatively induced demand will by default be served by the almost 80 percent of existing supply resources that deploy fossil fuels. This will increase their use and prolong the duration and intensity of the operation of older fossil fuel-fired power generation.[314] If such asynchronization of rapidly increasing electric power demand and insufficient transmission of new renewable power supply occurs, this will result in increased GHG emissions, warming the climate instead of cooling it in the near term.[315]
After Princeton University conducted research on which the Biden Administration relied to promote its IRA passage,[316] the University became more pessimistic regarding what would occur after reassessing the enacted IRA: even if transmission infrastructure expansion continues at current rates, the Princeton team’s model calculates that—as a result of the IRA—there will be an additional 110 to 250 million tons per year of coal burned,[317] and natural gas use will be increased and remain elevated for more than the next decade.[318] This will cause power-sector carbon dioxide emissions over the 2025–2035 period to increase more than if the IRA had not been enacted.[319]
A rapidly increased demand for electric power in the United States due to recent laws still remains unsynchronized with the ability to transmit new renewable electric bulk power to consumers. The Rapid Energy Policy Evaluation & Analysis Toolkit (“REPEAT”) team at Princeton forecasts that this demand will cause existing fossil fuel-fired power plants to avoid retirement and to increase operation, thus emitting dramatically more climate-warming GHGs and frustrating 80 percent of the IRA’s pledged transition to renewable energy.[320] The REPEAT team—which the Biden Administration relied on and quoted to cause the IRA to be passed by the Senate in a single vote—subsequently changed its assessment to conclude that legal transmission infrastructure barriers to support renewable energy will frustrate the vast majority of the previously claimed benefits, thus causing a substantial increase in U.S. fossil fuel climate-warming emissions.[321] While the Biden Administration pledged that enacting the IRA would reduce GHG emissions by 2030, the REPEAT team has since determined that “[f]ailing to accelerate transmission expansion beyond the recent historical pace (~1%/year) increases 2030 U.S. greenhouse emissions by ~800 million tons per year, relative to estimated reductions in [a transmission] unconstrained IRA case.”[322] Rather than a rapid decrease in GHG emissions, the REPEAT study that the Biden Administration relied upon for its modeling now says that “To achieve IRA’s full emissions reduction potential, new clean electricity must be rapidly added to both meet growing demand from electrification and reduce fossil fuel use in the power sector. Constraining transmission growth severely limits the expansion of wind and solar power.”[323] This projected increase represents a more than 20 percent greater amount of annual carbon dioxide emissions than expected every year through 2030 and perhaps beyond because of constrained transmission.
VI. Efficiency Technology Bridging Expanding Demand
The law must synchronize new sustainable power supply with recent statutorily ramped-up electricity demand in order for the U.S. economy to successfully operate on a different, more sustainable, form of energy. There may be legal consequences for missing this link: A resolution was approved by the U.N. General Assembly which facilitates a petition before the International Court of Justice (“ICJ”) to define “the obligations of States . . . to ensure the protection of the climate system,” and also to specify “the legal consequences under these obligations for States which, by their acts and omissions, have caused significant harm to the climate system.”[324] Multiple pending legal actions in U.S. courts also assert U.S. government negligence and liability for omissions exacerbating rather than mitigating climate change.[325]
A strategic legal “bridge” is needed immediately to span this anticipated significant shortcoming in order to accomplish accelerated reduction of GHG emissions during the rapid electrification of the entire infrastructure of the U.S. economy. If supply of new renewable power does not match or exceed accelerating demand for electricity pursuant to the IRA, the electric power system can and will collapse.[326] Greater U.S. use of fossil fuel-fired electricity causes more extensive and irreparable damage to world climate. Neither the IRA nor the IIJA contain mechanisms to mandate or incentivize renewable power supply to match or maintain pace with fast-escalating electric demand. Consequently, the resulting asynchrony of U.S. law by the second-largest GHG emitter among all nations accelerates irreversible warming of the climate.[327] This Article proposes a combined legal and technology “bridge” to address and solve the asynchrony.
A. Decoupling Entropy
This Section of the Article constructs a much-needed bridge. State, local, and federal policymakers can rapidly construct that legal bridge over energy demand/supply asynchrony. Government officials can do so by encouraging and/or mandating modular deployment of greater energy efficiency technology implemented across the residential, commercial, and industrial sectors of the U.S. economy. Efficiency improvement can be implemented quickly across every sector of the economy without additional multiyear Environmental Impact Statements (“EISs”).[328] When EISs are undertaken by the federal government, they typically take more than four years[329] and act as a prerequisite before developers may obtain other necessary pre-construction federal, state, and local permits required for erecting additional power generation facilities.[330]
This bridge can be constructed with positive, rather than negative, impacts on the U.S. economy and gross domestic product (GDP): While it is traditionally assumed that electric power and GDP move in tandem,[331] that relationship is decoupled with more energy efficiency, lifecycle cost efficiency reducing carbon, as well as cost for each dollar invested over the life of the investment and conservation.[332] Greater energy efficiency limits the entropy of U.S. power by replacing a portion of energy use with conservation of energy through the application of energy-saving technology. The U.S. Department of Energy, Energy Information Agency (“EIA”) forecasts that this decoupling of power and economic growth will continue: “EIA’s projections point to a continued decline in electricity use relative to economic growth.”[333]
Along with forecasted population expansion and this increase in global power-intensity of per capita energy use, global primary energy consumption could rise by up to 50 percent by 2050, directly damaging the climate.[334] A continued decoupling of electricity use and GDP, as well as an increase in energy efficiency of approximately 250 percent of what occurred during the last decade, must now occur to counterbalance other factors to reach a net-zero economy according to the IEA.[335]
B. Reactivating a Missing Link: Energy-Efficiency Technology Legal Triage
There is a critical missing link in the current IRA and IIJA, where both laws are rapidly accelerating the electrification of the entire U.S. economy. This link needs to:
- Consciously synchronize the massive electrification of the economy on pace with the development and availability of sufficient sustainable power generation to replace conventional fossil fuel-fired electricity generation; and
- Circumvent supply-chain delays for rare-earth and critical minerals that are required for sustainable renewable energy technology generation and transmission expansion.
Nowhere in U.S. law or in any court precedent is there such a connecting link or legal synchronization of environmental regulatory objectives for less pollution with operating requirements for the electric power sector, which is obligated to supply all power demanded.[336] After the MQD was invoked and applied in West Virginia v. Environmental Protection Agency to substantially restrict executive-branch power over both existing operating protocols of the U.S. electric system and additional environmental climate change regulations, there are fewer tools available.[337] A bridge can be built without needing to change any U.S. law by instead increasing energy-efficiency technology under existing law: Consumers that use energy more efficiently for the same work as a result conserve energy at less cost than generating more energy[338] and reduce entropy under the second law of thermodynamics, thus reducing climate warming.[339]
The American Council for an Energy-Efficient Economy (“ACEEE”) reported that the cost of energy conservation had been maintained at about $0.024/kWh of electricity saved.[340] Each kWh saved by greater efficiency frees up an unconsumed kWh for use by another consumer at less cost than generating additional power—it is a win-win for consumers lowering their energy costs, all citizens in terms of less air emissions from less use of fossil fuels, and for the American power system where the transmission system will be less stressed attempting to handle additional power. Utilities have since expanded their efficiency portfolios. This has led to an increase in energy-efficiency savings. It thus is the cheapest, least-cost energy resource at $0.024 cents/kWh saved in June 2021.[341] Some analysts argue that the conserved energy cost is less than $0.01/kWh achieved: analysis by the Electric Power Research Institute puts the amount closer to $.04/kWh, while others argue that this may understate the true achieved cost.[342] Part of the technology challenge is cost-effective efficiency implementation in each sector of the economy. The energy end uses that can operate significantly more efficiently and at less cost through energy efficiency are different in each sector of the economy:
- Residential energy efficiency impacts are concentrated in the space heating, water heating, space cooling, and lighting end uses, as well as heating equipment tune-ups.[343]
- Commercial-sector energy efficiency impacts are concentrated in indoor lighting, heating, space cooling, and whole building end uses.
- Industrial-sector energy impacts are concentrated in motor drive improvements and whole plant innovations.[344]
Key for the U.S. market-driven economy is that energy-efficiency technology costs less to implement than building or operating new generating facilities.[345] States can take the lead: States that implemented energy-efficiency resource standards, such as California, Massachusetts, and New York, among others, yielded four times more energy savings than states without such a standard.[346] Energy efficiency has often been a low priority. Its lower cost for energy benefits delivered warrant a second look now given current policy asynchrony: “Prioritizing energy efficiency is central to advancing the energy transition in America and meeting our climate goals.”[347] Energy-efficient appliances, buildings, vehicles, and industrial plants could halve U.S. energy use and GHG emissions by 2050, deliver energy savings worth more than $700 billion by 2050, and benefit job creation and public health.[348] For example, this solution can be accelerated today and reduce the need by half for renewable energy to catch up with fast-expanding power demand and do so at a lower cost. A Department of Energy assessment established energy efficiency options:[349]
- Use of the most efficient wall, window, and HVAC equipment now available could:
- reduce commercial heating by 77 percent;
- reduce cooling by 78 percent; and
- do so against a theoretical limit of 92 percent reduction.
- Lighting efficiency and controls could:
- reduce residential lighting energy at 93 percent of the theoretical limit; and
- reduce commercial lighting energy at 81 percent of the theoretical limit.
Energy efficiency measures in the industrial sector are not subject to the supply-chain issues associated with large amounts of critical minerals and rare earths for new power generation previously noted in Section V.B.1 above.[350] Distributed decentralized energy resources tend to fail less than centralized plants and are faster to fix.[351] Adding energy storage also can improve total value with energy efficiency.[352]
C. The Legal “Bridge”
With the IRA uniquely accelerating the electrification of the entire U.S. economy, the country can only succeed in meeting international carbon-emission-reduction pledges if law and policy are carefully legally synchronized. The IRA provides a broad array of subsidies, although it does not synchronize these renewable-energy subsidies with the accelerating demand for more electricity; moreover, supply chain impediments as well as rare earths and critical minerals are not yet within immediate control of U.S. law and policy.
This Article’s prior Section designs a bridge that can be constructed under existing law without needing to return to Congress for legislative amendments to the IRA, IIJA, or any other laws.[353] Greater efficiency and energy conservation occurring within and to existing U.S. buildings can be accomplished without any required permits or National Environmental Protection Act (“NEPA”) multiyear delays that afflict additional power generation and power transmission infrastructure siting.[354] Within existing U.S. law, the aforementioned bridge can be strategically implemented as a win-win for all stakeholders:
- Energy efficiency is less expensive and more cost-effective than constructing and operating additional power generation facilities.[355]
- Greater efficiency minimizes costs incurred by the consumer who owns the behind-the-meter conservation improvements which continue to reduce energy demands.[356]
- Through Energy Service Companies, the cost and savings of energy efficiency can legally be shared between the consumer and the efficiency development company.[357]
- There are no legal barriers to improvements inside buildings to increase efficiency or more efficient appliances and controls which require no additional local permits nor are they associated with siting new power generation.[358]
- Efficiency diversifies power resources, diminishing entropy and GHG emissions.[359]
This sound alternative legal policy option will ramp up energy efficiency to “bridge” around and significantly reduce demand increases for fossil fuel use otherwise outpacing renewable energy supply while simultaneously reducing the cost incurred compared to all power-generation alternatives.[360] The IRA contains some efficiency tax credits and grants,[361] although those are a minor part of the Act and are not synchronized with the Act’s rapid electrification of U.S. building heating and EV rollout. The IIJA provides $3.5 billion for the long-standing Weatherization Assistance Program, as well as $550 million for block grants for energy efficiency to states and $500 million in grants to public schools for energy-efficiency and renewable-energy expenditures.[362]
For EV-transportation and building-heating electrification increased demand, additional power demand is forecast to be 12 percent by 2030 and 20 percent by 2035, compared against approximately 17.5 percent of primary energy use currently being electric.[363] U.S. electricity demand increases from 2022, including for EVs, “is expected to increase up to 18% by 2030 and 38% by 2035, according to an analysis by the Rapid Energy Policy Evaluation and Analysis Toolkit, or REPEAT, an energy policy project out of Princeton University. That’s a big change over the roughly 5% increase we saw in the past decade.”[364]
Doubling electric use in the short period of time when 60 percent of existing fossil fuel-fired power is to be retired by 2035 under the Biden plan would require an approximately eightfold increase in the current approximately 20 percent of electric power that is now renewable.[365] Serving all electric power demand, including its fast-increasing electrification of the entire U.S. economy to displace use of fossil fuels, would require adding the entire amount of renewable power in place today to the U.S. electric system every eighteen months through 2035, which is a heavy lift. It required forty-five years since the enactment of the Public Utility Regulatory Policies Act of 1978 to reach the level of 20 percent renewable power existing today.[366] If demand exceeds supply of zero-carbon power, electric utilities are obligated to operate sufficient resources to serve whatever that demand is pursuant to their state franchises and state public utility commission orders:
For hundreds of years, public utilities have assumed obligations to extend service to customers within their service territories and to continue providing service once service has commenced. At common law and under statutes and regulations passed in the twentieth century by state and federal regulators, public utilities are obligated—largely as conditions of their monopoly franchises—to provide service to all customers within their service territories, sometimes even when the cost of providing service to a customer is in excess of the anticipated revenue from that customer. Although ordinary private businesses may unilaterally refuse to deal with particular customers and set the terms and conditions under which they contract pursuant to antitrust laws, utilities are held to significantly more rigorous dealing requirements and service terms and conditions. . . . It is comprised of distinct obligations to extend service, and to maintain certain quality standards once service commences. . . . [T]he obligations applicable to utilities are extraordinary, often requiring utilities to extend and provide service to customers where it is not always profitable to do so.[367]
Given the obligation under U.S. utility law to supply any and all demand for power, even if rapidly increased by the IRA or the IIJA,[368] modular energy efficiency technology is now available and proven to reduce this demand, does not require multiyear NEPA EIS or new permits,[369] and can lower cost and advance environmental equity for each customer while not exacerbating irreversible climate change.[370] This alternative energy-efficiency technology is capable of immediately bridging more than half of U.S. power demand, which is enough to sustainably cover most anticipated increases in U.S. power use in the next decade or, if necessary, even until 2050.[371] Energy efficiency certainly can supply the portion of additional U.S. power demand over the next decade not met by a parallel contemporaneous augmentation of additional needed renewable power supply.[372] This may be the only means to re-synchronize U.S. sustainable technology to meet U.S. climate-change-mitigation legal commitments. It is the legal choice of a mechanism for the United States not to proceed on what the U.N. Secretary-General calls the “highway to climate hell with our foot still on the accelerator.”[373]
This energy-efficiency “bridge” is the only option that can be implemented with no additional multiyear delay for EIS preparation and public comment and no additional preconstruction permits because it is implemented inside already-constructed buildings for which interior space is not considered part of the ambient environment, and energy efficiency decreases rather than increases energy use and its environmental impacts. There is a variety of energy-efficiency technologies that will reduce, rather than increase, the total energy bill borne by consumers as they and the economy use electricity for many more tasks. A permanent return benefit of reduced energy costs is realized by consumers who implement energy efficiency.
During a time when there is conflict between local, state, and federal government, until the supply of additional sustainable power supply is synchronized to catch up with rapidly increasing electric demand, deployment of energy-efficiency alternatives can be tailored to particular policy preferences. Most important in the current political climate, lower levels of government can craft their own methods at their own pace to foster and increase energy efficiency through incentives or additional regulation. Government incentives supporting energy efficiency contribute less to the national deficit than the IRA grants and incentives for additional construction of power supply, now forecast to be triple their originally estimated cost to the federal government.
World climate will clearly benefit from the deployment of energy efficiency and reduction of energy demand compared to longer-term and more robust operation of the most polluting fossil-fueled power plants to satisfy greater demand. The opportunity to create an energy-efficiency “bridge,” although relatively secondary and not enjoying major funding in the IIJA and IRA, may be the only short-term option to coordinate and synchronize a rapid shift to more electric energy use without ramping up greater fossil-fuel GHG emissions. An energy-efficiency “bridge” aligns with national and international climate policy commitments.
Energy-efficiency options save money for U.S. consumers compared to consumers purchasing additional electric energy. It is one of few win-win alternatives in the climate-control toolbox for all stakeholders.[374] Decision-makers should appreciate that a bridge solution may be necessary to choose and provide incentives leading along a sustainable path until the IRA’s rapidly increasing power demand is resynchronized under U.S. policy with sustainable power supply.
*Steven Ferrey is Professor of Law at Suffolk University Law School and served as Visiting Professor of Law at Harvard Law School. Since 1993, Professor Ferrey has served as a primary legal advisor to the World Bank and the United Nations on their renewable energy and climate change policies. He is the author of more than one hundred law review articles and seven books on energy, constitutional, and environmental law and policy; his most recent books are Unlocking the Global Warming Toolbox (2010); Environmental Law: Examples & Explanations (9th ed. 2022); and The Law of Independent Power (61st ed. 2023). Professor Ferrey thanks his Research Assistants, Kiara Benac, Sydney Cramer, and Amanda Nealon, for their excellent assistance.
- See James Fallows, The 50 Greatest Breakthroughs Since the Wheel, Atlantic (Nov. 2013), https://www.theatlantic.com/magazine/archive/2013/11/innovations-list [https://perma.cc/NQ2B-54AN] (stating that electricity finished behind only the movable-type printing press). ↑
- See Inflation Reduction Act, Pub. L. No. 117-169, 136 Stat. 1818 (2022). ↑
- See Infrastructure Investment and Jobs Act, Pub. L. No. 117-58, § 80503, 135 Stat. 429, 1336 (2021). ↑
- Brad Plumer, The U.S. Has Billions for Wind and Solar Projects. Good Luck Plugging Them In, N.Y. Times (Feb. 23, 2023), https://www.nytimes.com/2023/02/23/climate/renewable-energy-us-electrical-grid.html [https://perma.cc/4UVH-ZJNW]. ↑
- See West Virginia v. EPA, 597 U.S. 697, 724 (2022). ↑
- See Renewable Energy, U.S. Dep’t of Energy: Off. of Energy Efficiency & Renewable Energy (Jan. 22, 2023), https://www.energy.gov/eere/renewable-energy [https://perma.cc/ER74-UEMP]. Such an eight-fold increase assumes that the zero-carbon-emitting electric power is renewable rather than the now more-expensive nuclear power options subsidized in the IRA. ↑
- 16 U.S.C. §§ 824a–w. ↑
- Id. ↑
- See Energy Sector, U.S. Dep’t of Homeland Sec., https://www.dhs.gov/energy-sector [https://perma.cc/32VF-64GS]. ↑
- See Michael Bruch et al., Power Blackout Risks: Risk Management Options 4 (Markus Aichinger ed., 2011), https://www.thecroforum.org/wp-content/uploads/2012/09/CRO-Position-Paper-Power-Blackout-Risks-1-1.pdf [https://perma.cc/4M8X-8C5A]. ↑
- See infra Section V.A. ↑
- See infra Section V.B. ↑
- See infra Section V.C. ↑
- See infra Part II. ↑
- See John Mauldin, Turning Bullish on Energy, Mauldin Econ. (Oct. 28, 2022), https://www.mauldineconomics.com/frontlinethoughts/turning-bullish-on-energy [https://perma.cc/5UVV-ZHKC]. ↑
- See Laura Goering, Explainer: How Close Are We to Passing 1.5 Degrees Celsius of Global Warming, Reuters (Nov. 14, 2022), https://www.reuters.com/business/cop/how-close-are-we-passing-15-degrees-celsius-global-warming-2022-11-14 [https://perma.cc/4LAY-UUBW]. ↑
- See Inflation Reduction Act, Pub. L. No. 117-169, 136 Stat. 1818 (2022). ↑
- See Infrastructure Investment and Jobs Act, Pub. L. No. 117-58, § 80503, 135 Stat. 429, 1336 (2021). ↑
- See infra Section III.C & Part V. ↑
- Federal Power Act, 16 U.S.C. §§ 791a–825r (2022). ↑
- See West Virginia v. EPA, 597 U.S. 697 (2022). ↑
- See infra Section IV.B.2. ↑
- See infra Sections III.A–B. ↑
- See Patrick Whittle & Cathy Bussewitz, Biden Faces Steep Challenges to Reach Renewable Energy Goals, ABC News (Mar. 3, 2021, 10:30 AM), https://abcnews.go.com/Business/wireStory/biden-faces-steep-challenges-reach-renewable-energy-goals [https://perma.cc/D7YY-VXK6]. ↑
- See infra Section V.B.1. ↑
- See infra Section V.A. ↑
- See Marc Pickren, 3.8 Trillion Green Investment Yields No Change in Fossil Fuel Consumption and Related Climate Impact, Medium (Oct. 30, 2022), https://medium.com/@marc.pickren/3-8-trillion-green-investment-yields-no-change-in-fossil-fuel-consumption-and-related-climate [https://perma.cc/63Y3-GPTN] (transcribing interview between CNBC and Jeff Currie, an Economist and Global Head of Commodities Research in the Global Investment Research Division at Goldman Sachs). ↑
- See infra Section VI.B. ↑
- See generally infra Section III.B.2, Part IV. ↑
- See infra Section IV.B.2. ↑
- See António Guterres, Sec’y Gen., U.N., Secretary-General’s Remarks to High-Level Opening of COP27 (Nov. 7, 2022), https://www.un.org/sg/en/content/sg/speeches/2022-11-07/secretary-generals-remarks-high-level-opening-of-cop27 [https://perma.cc/SCU5-CEF9] (opening 27th Conference of the Parties with warnings of “dire” need for clean energy transition in a decade). ↑
- See id. ↑
- See Paris Agreement to the United Nations Framework Convention on Climate Change, Dec. 12, 2015, T.I.A.S. No. 16-1104, art. II(1)(a), https://www.state.gov/wp-content/uploads/2021/05/16-1104-Environment-and-Conservation-Multilateral-Paris-Agreement.pdf [https://perma.cc/9P98-TYDR]. ↑
- Mauldin, supra note 15 (“The world must cut emissions 43% by 2030 to meet Paris goals. Instead, they’re set to rise 10.6%.”). ↑
- Id. ↑
- See. Intergovernmental Panel on Climate Change, Climate Change 2022: Impacts, Adaptation and Vulnerability 16 (2022), https://report.ipcc.ch/ar6wg2/pdf/IPCC_AR6_WGII_SummaryForPolicymakers.pdf [https://perma.cc/CZ3G-CT7B]. ↑
- See Whittle & Bussewitz, supra note 24. ↑
- See United Nations Framework Convention on Climate Change, Conference of the Parties Serving as the Meeting of the Parties to the Paris Agreement, UN Doc. FCCC/PA/CMA/2022/4 (2022), https://unfccc.int/sites/default/files/resource/cma2022_04.pdf [https://perma.cc/6LAH-PVH9] (containing information from the 166 latest available Nationally Determined Contributions communicated by 193 Parties to the Paris Agreement) (“The best estimate of peak temperature in the twenty-first century, projected mostly for 2100 when temperature continues to rise, is in the range of 2.1–2.9 °C.”); Max Bearak, Climate Pledges Are Falling Short, and a Chaotic Future Looks More Like Reality, N.Y. Times (Oct. 26, 2022), https://www.nytimes.com/2022/10/26/climate/un-climate-pledges-warming.html [https://perma.cc/F9MM-8ZTD] (“Just 26 of the 193 nations that agreed to step up their climate actions have created more ambitious plans. . . . With each fraction of a degree of warming, tens of millions more people worldwide would be exposed to life-threatening heat waves, food and water scarcity, and coastal flooding while millions more mammals, insects, birds and plants would disappear.”). ↑
- See Whittle & Bussewitz, supra note 24. ↑
- Bearak, supra note 38. ↑
- Paris Agreement to the United Nations Framework Convention on Climate Change, supra note 33. ↑
- Chris Mooney et al., Countries’ Climate Pledges Built on Flawed Data, Post Investigation Finds, Wash. Post (Nov. 7, 2021), https://www.washingtonpost.com/climate-environment/interactive/2021/greenhouse-gas-emissions-pledges-data [https://perma.cc/Z72R-BNWW]; see Paris Agreement to the United Nations Framework Convention on Climate Change, supra note 33 (regarding methane emissions); Steven Ferrey, The Second Element, First Priority, 24 B.U. J. Sci. & Tech. L. 41 (2018); see also Steven Ferrey, Unforced Errors, Legal Fulcrum & International Climate, 20 Minn. J.L. Sci. & Tech. 115 (2018). See generally World Energy Outlook 2021, Int’l Energy Agency (2021), https://iea.blob.core.windows.net/assets/4ed140c1-c3f3-4fd9-acae-789a4e14a23c/WorldEnergyOutlook2021.pdf [https://perma.cc/ES7A-FRW5]. ↑
- See Fiona Harvey, Oil and Gas Greenhouse Emissions ‘Three Times Higher’ than Producers Claim, Guardian (Nov. 9, 2022), https://www.theguardian.com/environment/2022/nov/09/oil-and-gas-greenhouse-emissions-three-times-higher-than-producers-claim [https://perma.cc/5XPG-5EDH]. ↑
- See Paris Agreement to the United Nations Framework Convention on Climate Change, supra note 33 (stating that fifty-two countries have not submitted any emissions inventories covering the last ten years); see also Al Gore, Measure Emissions to Manage Emissions, 378 Science 455, 455 (2022) (noting that fifty-two countries have not submitted any emissions inventories covering the past ten years). The inventories that do exist often have large omissions and fail to provide the granular data needed to make decisions. Id. ↑
- See Paris Agreement to the United Nations Framework Convention on Climate Change, supra note 33; World Energy Outlook 2021, supra note 42. ↑
- See World Energy Outlook 2021, supra note 42. ↑
- See Editorial Board, Climate Doomsday Is Nigh – Again, Wall St. J. (Oct. 31, 2022, 6:39 PM), https://www.wsj.com/articles/climate-doomsday-is-nigh-again-united-nations-environment-climate-change-fossil-fuels [https://perma.cc/P7F3-PNAQ]. ↑
- See U.S. Dep’t of Energy, Transforming the Nation’s Electricity System: The Second Installment of the Quadrennial Energy Review (2017), https://www.energy.gov/sites/prod/files/2017/02/f34/Quadrennial %20Energy%20Review%20Summary%20for%20Policymakers.pdf [https://perma.cc/XJ2D-QM4R]. ↑
- See infra at Figure 2. ↑
- See Inventory of U.S. Emission Sources and Sinks, EPA (Nov. 8, 2023), https://www.epa.gov/ghgemissions/inventory-us-greenhouse-gas-emissions-and-sinks [https://perma.cc/R2BV-D38Y]. ↑
- See Inflation Reduction Act, Pub. L. No. 117-169, 136 Stat. 1818 (2022). ↑
- See Infrastructure Investment and Jobs Act, Pub. L. No. 117-58, § 80503, 135 Stat. 429, 1336 (2021). ↑
- U.S. Dep’t of Energy, The Inflation Reduction Act Drives Significant Emissions Reductions and Positions America to Reach Our Climate Goals 3 (2022) https://www.energy.gov/sites/default/files/2022-08/8.18%20InflationReductionAct_Factsheet_Final.pdf [https://perma.cc/37T4-JEM9]. ↑
- Id. (providing graph for Estimated Emissions Reductions in 2030 from Inflation Reduction Act and Infrastructure Investment and Jobs Act). ↑
- See FACT SHEET: President Biden Sets 2030 Greenhouse Gas Pollution Reduction Target Aimed at Creating Good-Paying Union Jobs and Securing U.S. Leadership on Clean Energy Technologies, White House (Apr. 21, 2022), https://www.whitehouse.gov/briefing-room/statements-releases/2021/04/22/fact-sheet-president-biden-sets-2030-greenhouse-gas-pollution-reduction-target-aimed-at-creating-good-paying-union-jobs-and-securing-u-s-leadership-on-clean-energy-technologies [https://perma.cc/A387-3YLR]. ↑
- See Whittle & Bussewitz, supra note 24. ↑
- See Paris Agreement to the United Nations Framework Convention on Climate Change, supra note 33. ↑
- See Bearak, supra note 38. ↑
- See id.; see also Paris Agreement to the United Nations Framework Convention on Climate Change, supra note 33; Editorial Board, supra note 47. ↑
- See John Bistline et al., Economic Implications of the Climate Provisions of the Inflation Reduction Act, Brookings Papers on Econ. Activities (2023); Josh Saul, Goldman Sees Biden’s Clean-Energy Law Costing U.S. $1.2 Trillion, Bloomberg (Mar. 23, 2023), https://www.bloomberg.com/news/articles/2023-03-23/goldman-sees-biden-s-clean-energy-law-costing-us-1-2-trillion?sref=MTy2GeXk [https://perma.cc/369D-P7SR]; see also Inflation Reduction Act of 2022 Substantially Changes Tax Code Provisions Related to Energy Transition and Renewable Energy, EY (Aug. 16, 2022), https://taxnews.ey.com/news/2022-1236-inflation-reduction-act-of-2022-substantially-changes-tax-code-provisions-related-to-energy-transition-and-renewable-energy [https://perma.cc/D7SJ-GMMX]. ↑
- See FACT SHEET: The Bipartisan Infrastructure Deal Boosts Clean Energy Jobs, Strengthens Resilience, and Advances Environmental Justice, White House (Nov. 8, 2021), https://www.whitehouse.gov/briefing-room/statements-releases/2021/11/08/fact-sheet-the-bipartisan-infrastructure-deal-boosts-clean-energy-jobs-strengthens-resilience-and-advances-environmental-justice [https://perma.cc/97P9-GFEM]. ↑
- See FACT SHEET: President Biden Announces Support for the Bipartisan Infrastructure Framework, White House (June 24, 2021), https://www.whitehouse.gov/briefing-room/statements-releases/2021/06/24/fact-sheet-president-biden-announces-support-for-the-bipartisan-infrastructure-framework [https://perma.cc/DBK6-KTGF] (listing that the IIJA Framework will “[e]lectrify thousands of school and transit buses across the country to reduce harmful emissions and drive domestic manufacturing of zero emission vehicles and components.”). ↑
- See Ferrey, The Second Element, First Priority, supra note 42; see also Ferrey, Unforced Errors, Legal Fulcrum & International Climate, supra note 42. ↑
- See Marianne Fay et al., Decarbonizing Development: Three Steps to a Zero-Carbon Future 25 (2015); Sustainable Dev. Sols. Network & Inst. Sustainable Dev. & Int’l Rels., Pathways to Deep Decarbonization 2014 Report (2014), https://www.iddri.org/sites/default/files/import/publications/ddpp_2014-report.pdf [https://perma.cc/2PY2-DRHW]. ↑
- See More Bad News for the Planet: Greenhouse Gas Levels Hit New Highs, World Meteorologic Org. (Oct. 26, 2022), https://public.wmo.int/en/media/press-release/more-bad-news-planet-greenhouse-gas-levels-hit-new-highs [https://perma.cc/MHR4-CLLX] (“Since 2007, globally-averaged atmospheric methane concentration has been increasing at an accelerating rate. The annual increases in 2020 and 2021 (15 and 18 ppb respectively) are the largest since systematic record began in 1983.”); see also Increase in Atmospheric Methane Set Another Record During 2021, Nat’l Oceanic & Atmospheric Agency (Apr. 07, 2022), https://www.noaa.gov/news-release/increase-in-atmospheric-methane-set-another-record-during-2021 [https://perma.cc/J22V-AK63] (explaining that NOAA’s preliminary analysis showed the annual increase in atmospheric methane during 2021 was 17 parts per billion [ppb], the largest annual increase recorded since systematic measurements began in 1983); Marcin Jozwiak, Climate Change: CO2 and Methane in Our Atmosphere Reach Record Levels, U.N. News (Oct. 26, 2022), https://news.un.org/en/story/2022/10/1129887 [https://perma.cc/9F2W-4Q54] (affirming that the annual increases in 2020 and 2021 are the largest since systematic registry began in 1983). ↑
- See More Bad News for the Planet: Greenhouse Gas Levels Hit New Highs, supra note 65 (highlighting that the atmospheric methane concentration in 2020 and 2021, 15 and 18 ppb respectively, represent the largest increase since 1983); see also Sharm-El-Sheikh, Eight Warmest Years on Record Witness Upsurge in Climate Change Impacts, World Meteorologic Org. (Nov. 6, 2022), https://public.wmo.int/en/media/press-release/eight-warmest-years-record-witness-upsurge-climate-change-impacts [https://perma.cc/A6DB-F22E] (reporting the 2021 annual increase in methane concentration was the highest on record). ↑
- See Gabrielle B. Dreyfus et al., Mitigating Climate Disruption in Time: A Self-Consistent Approach for Avoiding Both Near-Term and Long-Term Global Warming, Proceedings of the Nat’l Acad. of Sci. (May 23, 2022), https://doi.org/10.1073/pnas.2123536119 [https://perma.cc/R7R4-FUTX] (“By 2050, the net avoided warming from the targeted non-CO2 measures is 0.26 °C, almost four times larger than the net benefit of decarbonization alone (0.07 °C).”); Duke Univ., Curbing Other Climate Pollutants, Not Just CO2, Gives Earth a Chance, Sci. Daily (May 24, 2022), https://www.sciencedaily.com/releases/2022/05/220524110638.htm [https://perma.cc/6EDT-TUKZ] (asserting that the simultaneous reduction of emissions of methane and other often overlooked climate pollutants could cut the rate of global warming in half by 2050). ↑
- Inflation Reduction Act § 13701 (to be codified at 26 U.S.C. § 45Y(a)). ↑
- Id. § 13702 (to be codified at 26 U.S.C. § 48E(a)). ↑
- Id. § 13101(a). ↑
- Id. § 13101(f) (to be codified at 26 U.S.C. § 45(b)(7)). ↑
- Id. (to be codified at 26 U.S.C. § 45(b)(8)); see Cong. Rsch. Serv., Registered Apprenticeship: Federal Role and Recent Federal Efforts (R45171) (Mar. 17, 2021) (for commentary on apprenticeship). ↑
- Inflation Reduction Act § 13701(f)(to be codified at 26 U.S.C. § 45(b)(7)–(8)). ↑
- Id. (to be codified at 26 U.S.C. § 45(b)(6)(B)). ↑
- Id. ↑
- Id. §§ 13701–13702 (to be codified at 26 U.S.C. §§ 45Y(d)(3), 48E(e)(3)). ↑
- Id. § 13102(k) (to be codified at 26 U.S.C. § 48(a)). ↑
- Id. ↑
- Id. § 13801 (to be codified at 26 U.S.C. § 6417); see Cong. Rsch. Serv., Tax Equity Financing: An Introduction and Policy Considerations (R45693) (Apr. 17, 2021) (providing commentary on tax-equity financing). ↑
- Id. § 13702 (to be codified at 26 U.S.C. § 48E). ↑
- Id. § 13702(a) (to be codified at 26 U.S.C. § 48E(a)). ↑
- Id. (to be codified at 26 U.S.C. § 48E(a)(3)(A)). Eligible as energy communities are contaminated “brownfields,” as well as “[a]ny census tract where a coal-fired power plant has closed since 2010, or a coal mine has closed since 2000 . . . . The IRA defines this third type of energy community as a metropolitan or non-metropolitan statistical area (as defined by the Office of Management and Budget) where ‘0.17 percent or greater direct employment or at least 25 percent of local tax revenues [are] related to extraction, processing, transport, or storage of coal, oil, or natural gas,’ and unemployment is at or above the national average in the previous year.” Daniel Raimi & Sophie Pesek, What Is an “Energy Community?”, Resources (Sept. 7, 2022), https://www.resources.org/common-resources/what-is-an-energy-community [https://perma.cc/Z85V-GQSA]. ↑
- Inflation Reduction Act § 13702(a) (to be codified at 26 U.S.C. § 48E(a)(3)(B)). ↑
- Id. § 13103 (to be codified at 26 U.S.C. § 48(e)). ↑
- Id. (to be codified at 26 U.S.C. § 48(e)(1)(A)(ii)). ↑
- Id. § 13101(d) (to be codified at 26 U.S.C. § 168(e)(3)(B)); Id.§ 13701 (to be codified at 26 U.S.C. § 45Y). ↑
- Id. § 13101 (to be codified at 26 U.S.C. § 45(b)(9)(B)(ii)). The IRA increases the amount of the credit from a base rate of 0.3 cents per kilowatt hour of electricity produced to 0.5 cents per kilowatt hour, and establishes a higher credit of 2.5 cents per kilowatt hour for projects that meet certain wage and apprenticeship requirements. Id. The credit can also be further increased if a project meets domestic content requirements or is located in an “energy community,” defined as a brownfield site, an area with employment significantly related to the fossil fuel industry, or a census tract (or immediately adjacent census tract) in which a coal mine has closed or a coal-fired electric generating unit has been retired. Id. ↑
- See Exec. Off. of Energy and Env’t Affs., MA Decarbonization Roadmap, Mass.gov, https://www.mass.gov/info-details/ma-decarbonization-roadmap [https://perma.cc/F2WW-7ZUX]. ↑
- See Exec. Off. of Energy & Env’t Affs., Massachusetts 2050 Decarbonization Roadmap 1 (2020), https://www.mass.gov/doc/ma-2050-decarbonization-roadmap/download [https://perma.cc/LTR7-5ZWF] [hereinafter Decarbonization Roadmap]. ↑
- Id. at 45–47. ↑
- See Exec. Off. of Energy & Env’t Affs., Building Sector Report: A Technical Report of the Massachusetts Decarbonization Roadmap Study 5 (2020), https://www.mass.gov/doc/buildings-sector-technical-report/download [https://perma.cc/3B9L-BTCF] [hereinafter Building Report]. ↑
- See Mass. Comm’n on Clean Heat, Final Report 1 (2022), https://www.mass.gov/doc/massachusetts-commission-on-clean-heat-final-report-november-30-2022/download [https://perma.cc/J2EJ-3VPV]. ↑
- See Sabrina Shankman, Massachusetts Should Be Converting 100,000 Homes a Year to Electric Heat. The Actual Number: 461, Bos. Globe (Aug. 21, 2021), https://www.bostonglobe.com/2021/08/21/science/massachusetts-should-be-converting-100000-homes-year-electric-heat-actual-number-461 [https://perma.cc/2M25-MR8K]; Building Report, supra note 91, at 7, 19. ↑
- Mass. Comm’n on Clean Heat, supra note 92. ↑
- See Decarbonization Roadmap, supra note 89, at 41. ↑
- See Matt Stout, Senate Climate Bills Would Push State to Adopt Carbon Pricing, Bos. Globe (Jan. 24, 2020), https://www.bostonglobe.com/2020/01/23/metro/senate-climate-bill-would-push-state-adopt-carbon-pricing [https://perma.cc/Q94W-XK6E]. ↑
- See H.B. 3292, 192nd Gen. Ct. (Mass. 2021), https://malegislature.gov/Bills/192/HD1972 [https://perma.cc/DH2P-D86X] (seeking to extend a current carbon fee on power plants to these additional sectors); see also Sarah Shemkus, Massachusetts Groups Back Expanded Carbon Tax with Focus on Equity, Energy News Network (Mar. 2, 2021), https://energynews.us/2021/03/02/massachusetts-groups-back-expanded-carbon-tax-with-focus-on-equity [https://perma.cc/7XC5-5GAT]. ↑
- See Ctr. for L., Energy & the Env’t, California Climate Policy Dashboard, Berkeley L., https://www.law.berkeley.edu/research/clee/research/climate/climate-policy-dashboard [https://perma.cc/PYU8-Y8KK]. ↑
- See Assem. B. 32, 2005 Leg., 2005–2006 Sess. (Cal. 2006), https://leginfo.legislature.ca.gov/faces/billTextClient [https://perma.cc/XJ7P-VUUY]; see also Cal. Air Res. Bd., AB Global Warming Solutions Act of 2006, CA.gov (Sept. 28, 2018), https://ww2.arb.ca.gov/resources/fact-sheets/ab-32-global-warming-solutions-act-2006 [https://perma.cc/88JS-CQ5J]. ↑
- See Off. of Governor Gavin Newsom, Governor Newsom Announces California Will Phase Out Gasoline-Powered Cars & Drastically Reduce Demand for Fossil Fuel in California’s Fight Against Climate Change, CA.gov (Sept. 23, 2020), https://www.gov.ca.gov/2020/09/23/governor-newsom-announces-california-will-phase-out-gasoline-powered-cars-drastically-reduce-demand-for-fossil-fuel-in-californias-fight-against-climate-change [https://perma.cc/ZND8-V7PA] [hereinafter Gasoline Phase Out] (declaring the executive order directs California to require that, by 2035, all new cars and passenger trucks sold in the state must be zero-emission vehicles). ↑
- See Cal. Exec. Order No. B-55-18 (2018), https://www.ca.gov/archive/gov39/wp-content/uploads/2018/09/9.10.18-Executive-Order.pdf [https://perma.cc/3U3R-4JZB]; see also SB 100 Joint Agency Report, Cal. Energy Comm’n, https://www.energy.ca.gov/sb100 [https://perma.cc/Y5W7-M8HM]. ↑
- See Caleigh Wells, California Plans to Phase Out New Gas Heaters by 2030, NPR (Sept. 23, 2022, 10:52 AM), https://www.npr.org/2022/09/23/1124511549/california-plans-to-phase-out-new-gas-heaters-by-2030 [https://perma.cc/VDZ3-5NVZ]. ↑
- See Town of Brookline, Reports of Select Board and Advisory Committee on the Articles in the Warrant for the Special Town Meeting (2019), https://www.brooklinema.gov/DocumentCenter/View/20751/Combined-Reports-November-2019-Brookline-Special-Town-Meeting-with-Supplements [https://perma.cc/YU6L-DREQ] (detailing Article 21 Select Board’s Supplemental Recommendation to see if the town will amend the general bylaws by adopting a new article 8.39 entitled “Prohibition on New Fossil Fuel Infrastructure in Major Construction”). ↑
- See Annie Sandoli, AG Rejects Brookline Anti-Fossil Fuel Ban for Second Time, Patch (Feb. 28, 2022) https://patch.com/massachusetts/brookline/ag-rejects-brookline-anti-fossil-fuel-bylaws-second-time [https://perma.cc/MPW6-C534] (reporting that AG Healey ruled for the first time on Brookline’s November 2019 efforts, reasoning that the bylaw was preempted because it went against state laws in three ways). ↑
- See id. (reporting that this is the second time Healey has rejected the town’s efforts to stop fossil fuel use in less than two years). ↑
- See An Act Driving Clean Energy and Offshore Wind of 2022, H.B. 5060, 192d Gen. Ct. (Mass. 2022) (including Brookline among the ten towns and cities). ↑
- See Susie Cagle, Berkeley Became First US City to Ban Natural Gas. Here’s What That May Mean for the Future, Guardian (July 23, 2019), https://www.theguardian.com/environment/2019/jul/23/berkeley-natural-gas-ban-environment [https://perma.cc/GQ6M-FCZK] (noting this first in California and elsewhere in the United States). ↑
- Cal. Restaurant Ass’n v. City of Berkeley, 547 F.Supp.3d 878, 883 (N.D. Cal. 2021) (upholding Berkeley’s exercise of general police power). ↑
- See Kristiana Faddoul, California’s Cities Lead the Nation on Pollution-Free Homes and Buildings, Sierra Club (July 22, 2021), https://www.sierraclub.org/articles/2021/07/californias-cities-lead-way-pollution-free-homes-and-buildings [https://perma.cc/Z6DW-26DH] (counting sixty-four similar local ordinances banning natural gas enacted by California counties and cities as of fall 2023). ↑
- Gallaher v. City of Santa Rosa, No. SCV-265711 (Cal. Super. Ct. April 22, 2021) (appealing Santa Rosa decision); see Santa Rosa, Cal., Code tit. 18, ch. 18-33.040 (2019) (requiring low-rise residential new construction to not utilize fossil fuels and to heat with electricity); see also Will Schmitt, Judge Favors Santa Rosa’s Defense to Developer’s Lawsuit over City’s Natural Gas Ban, Press Democrat (Jan. 27, 2021), https://www.pressdemocrat.com/article/news/judge-favors-santa-rosas-defense-to-developers-lawsuit-over-citys-natura [https://perma.cc/V6X2-J8Z9]. ↑
- See Wells, supra note 102 (reporting that California is the first in the nation to begin making fossil-fuel furnaces and heaters a thing of the past beginning in 2030). ↑
- Uwe R. Fritsche & Felix Chr. Matthes, Changing Course: A Contribution to a Global Energy Strategy (GES) 14 (Heinrich Boll Found., Paper No. 22, 2003), http://www.loy-energie.de/download/changing_course.pdf [https://perma.cc/28LR-LTZ2]. ↑
- See Global Energy Consumption, World Counts (Jan. 21, 2023), https://www.theworldcounts.com/challenges/climate-change/energy/global-energy-consumption [https://perma.cc/KZW4-HZP5] (“[T]he annual global energy consumption is estimated to 580 million terajoules. That’s 580 million trillion joules or about 13865 million tons of oil equivalents.”); Statista Research Department, Net Electricity Consumption Worldwide in Select Years from 1980 to 2021, Statista (Jan. 16. 2023), https://www.statista.com/statistics/280704/world-power-consumption [https://perma.cc/VW27-SQKM] (graphing the continuous growth of world electricity consumption over the past half-century, reaching approximately 25,300 tWh in 2021); see also Maria Trimarchi, How Much Power Does the World Consume?, How Stuff Works (Sept. 02, 2008), https://science.howstuffworks.com/environmental/green-science/world-power-consumption.htm [https://perma.cc/AY8H-NWGG] (reporting that the world’s population consumes 15 terawatts of power from a combination of energy sources). Terawatts, equal to 1012 watts. See Watt-Hour, Energy Educ., https://energyeducation.ca/encyclopedia/Watt-hour [https://perma.cc/U3LF-6WQS]. ↑
- See U.S. Energy Admin. Info., Today in Energy: In 2018, U.S. Energy Expenditures Increased for the Second Consecutive Year, U.S. Energy Info. Admin. (Sept. 10, 2020), https://www.eia.gov/todayinenergy/detail.php?id=45076 [https://perma.cc/35PT-LSQL] (reporting that the total amount of money spent directly by consumers to purchase energy increased for the second year in a row to $1.3 trillion in 2018); see also Annual Energy Outlook 2022, U.S. Energy Info. Admin. (Mar. 03, 2022), https://www.eia.gov/outlooks/aeo/narrative/consumption/sub-topic-03.php [https://perma.cc/TK69-26LY] (projecting that energy consumption will increase “through 2050 as population and economic growth outweighs efficiency gains”). ↑
- See Nancy Hall, First Law of Thermodynamics, Nat’l Aeronautics & Space Admin. (May 13, 2021), https://www.grc.nasa.gov/www/k-12/airplane/thermo1.html [https://perma.cc/4GGV-WKP6] (providing information on the First Law of Thermodynamics). ↑
- See id.; see also Energy Education: Concepts and Practices: Unit 2: Energy Rules! Section C. Energy Conversion and the First Law of Thermodynamics, Univ. of Wis. (Jan. 21, 2023), https://www.uwsp.edu/wcee/wcee/pd/keep-pd/energy-module/unit-2-section-c [https://perma.cc/9WM2-CK5U] (explaining how the first law of thermodynamics states that energy can neither be created nor destroyed; it can only be converted from one form to another). ↑
- See Hall, supra note 115 at 5140; Energy Education: Concepts and Practices: Unit 2: Energy Rules! Section D. Energy Efficiency and the Second Law of Thermodynamics, supra note 116 (noting the chemical energy found in fossil fuels, such as coal and oil, and in nuclear resources). ↑
- See Hall, supra note 115. ↑
- Id. While energy can be conserved in any conversion, the conversion itself only increases the entropy of the universal energy system. There is absolutely nothing that can be done to reverse this decrease of the utility of energy, although the sun constantly provides an additional stream of daily energy. This results in the loss of complexity and greater homogeneity of energy as it is dissipated. ↑
- See Willie Soon et al., Re-Evaluating the Role of Solar Variability on Northern Hemisphere Temperature Trends, 150 Earth-Sci. Revs. 409 (2015). ↑
- See Hall, supra note 115. ↑
- See id. (informing how the transfer of heat goes from the hot object to the cold object). Entropy represents a useful state. Id.; see also Entropy, Energy Educ. Univ. of Calgary (Dec. 22, 2022), https://energyeducation.ca/encyclopedia/Entropy [https://perma.cc/UM7W-C3L9] (“[E]ntropy can be regarded as a measure of the effectiveness of a specific amount of energy.”); Richard Wolfson, Energy, Environment, and Climate, 81–84 (2d ed. 2012) (presenting how the increase in entropy decreases the energy quality). ↑
- 16 U.S.C. § 824(b)(1). ↑
- Id. § 824(a). ↑
- See Fed. Power Comm’n v. S. Cal. Edison Co., 376 U.S. 205, 215–16 (1964) (“[A] bright line easily ascertained . . . making unnecessary . . . case-by-case analysis.”). ↑
- See New Eng. Power Co. v. New Hampshire, 455 U.S. 331 (1982) (violation of Supremacy Clause, Federal Power, Act, and the Dormant Commerce Clause of the U.S. Constitution); see also Montana-Dakota Co. v. Pub. Serv. Comm’n, 341 U.S. 246, 251 (1951); Nantahala Power & Light Co. v. Thornburg, 476 U.S. 953 (1986); Miss. Power & Light Co. v. Miss. Ex rel. Moore, 487 U.S. 354 (1988); Entergy La., Inc. v. La. Pub. Serv. Comm’n, 539 U.S. 39 (2003). ↑
- 16 U.S.C. §§ 824(d)–(e). ↑
- Id. ↑
- See Pub. Util. Dist. No. 1 v. FERC, 471 F.3d 1053, 1058 (9th Cir. 2006). ↑
- Industry Data, EEI (Jan. 21, 2023), https://www.eei.org/en/resources-and-media/industry-data [https://perma.cc/7M5G-LF7M] (providing statistics that electricity generation at independent power producer-owned plants totaled 1,918,425 GWh, accounting for 46.6 percent of the total electricity generation in the United States in 2021); U.S. Energy Info. Admin., Electric Power Monthly with Data for Aug. 2015, at tbls. 1.2, 1.3, 1.4. 1.5, 1.6a (2015), http://www.eia.gov/electricity/monthly/archive/October2015.pdf [https://perma.cc/U5UZ-YLT6]; see Promoting Wholesale Competition Through Open Access Non-Discriminatory Transmission Services by Public Utilities, 61 Fed. Reg. 21540, 21545, 21549 (May 10, 1996) (to be codified at 18 C.F.R. pts. 35, 385). ↑
- Lawrence Greenfield, An Overview of the Federal Energy Regulatory Commission and Federal Regulation of Public Utilities (June 2018), https://www.ferc.gov/sites/default/files/2020-07/ferc101.pdf [https://perma.cc/VFZ6-WFAN] (“Transmission of electric energy in interstate commerce by public utilities, i.e., the rates, terms & conditions of interstate electric transmission by public utilities – FPA 201, 205, 206 (16 USC 824, 824d, 824e).”); Conn. Light and Power Co., 70 FERC ¶ 61,012, at ¶ 61,030 (1995); Cent. Vt. Pub. Serv. Corp., 84 FERC ¶ 61,194, at ¶ 61,973-75 (1998); Niagara Mohawk Power Corp., 100 FERC ¶ 61,019 at ¶ 61,017 (2002); Entergy Servs., Inc., 120 FERC ¶ 61,020, at ¶ 61,028 (2007); Aquila Merch. Servs., Inc., 125 FERC ¶ 61,175, at ¶ P 17 (2008). ↑
- See Mark F Sundback et al., Electricity Regulation in the United States: Overview, Prac. L. (July 01, 2020), https://1.next.westlaw.com/Document/Ieb49d7b91cb511e38578f7ccc38dcbee/View/FullText.html?transitionType=Default&contextData=(sc.Default)&firstPage=true&bhcp=1 [https://perma.cc/369T-M9YX] (explaining that states have jurisdiction over local distribution, retail sales of electricity within a state from one entity to an end user, and the siting and construction of transmission facilities, generation facilities, and distribution systems); Transmission Planning and Cost Allocation by Transmission Owning and Operating Public Utilities (Order 1000), 76 Fed. Reg. 49,842 (Aug. 11, 2011) (requiring nondiscriminatory access by all parties to transmission infrastructure). The federal government controls all permitting for development on federal lands. U.S. Const. art. IV, § 3, cl. 2. The Property Clause gives Congress authority over federal property generally, and the Supreme Court has described Congress’s power to legislate under this Clause as “without limitation.” Bill Howell, Federal Power over Public Lands, https://www.congress.gov/116/meeting/house/110088/documents/HHRG-116-II13-20191017-SD043.pdf [https://perma.cc/RHV4-PLZU]. ↑
- See What FERC Does, Fed. Regul. Energy Comm’n, https://www.ferc.gov/about/what-ferc/what-ferc-does [https://perma.cc/7F9G-F3DZ]. ↑
- See Steven Ferrey, Law of Independent Power § 5:10 (60th ed. 2023); Steven Ferrey, Environmental law: Examples & Explanation 631–32 (9th ed. 2022) [hereinafter Ferrey, Environmental Law]; Steven Ferrey, The New Rules 23–24, 46–47 (2000). ↑
- See Pub. Util. Dist. No. 1 v. FERC, 471 F.3d 1053, 1058 (9th Cir. 2006); Fed. Energy Regul. Comm’n, Docket No. RM10-23-000; Order No. 1000, Transmission Planning and Cost Allocation by Transmission Owning and Operating Public Utilities 136 (2011). FERC. Stats. &. Regs. ¶ 61051. (2011); Ferrey, Environmental Law, supra note 134, at 609. ↑
- Power Grid Fundamentals and Electricity Pricing, EnergyCAP, LLC (Jan. 21, 2023), https://www.energycap.com/resource/power-grid-fundamentals-and-electricity-pricing [https://perma.cc/3J6M-VHFM] (providing Dave Barry quote on “What Is Electricity”). ↑
- See Electricity Explained: Measuring Electricity, U.S. Energy Info. Admin. https://www.eia.gov/energyexplained/electricity/measuring-electricity.php [https://perma.cc/5G4U-FCVT]. ↑
- See e.g. Nancy Hall, Work, NASA Glenn Rsch. Ctr. (Jan. 21, 2022), [https://perma.cc/V3BY-X34X] (live page not found) (explaining how, for scientists, work is the product of a force acting on an object times the distance that the object moves, and power is the time rate of change of work). For example, one measures force in the units of Newtons per meter (N/m), which is then the definition of a joule (J). A joule is the standard scientific unit for energy and work. One joule of energy is equivalent to about thirty micrograms of coal. ↑
- Id. Thus, it is measured in joules per second. One joule per second is called a watt. One watt of power is equivalent to a burning candle or that expended by a hummingbird. One horsepower, a proximate power of one horse tethered to a wheel, is equal to approximately 750 watts. ↑
- See e.g., Electrical Potential and Potential Difference, in Samuel J. Ling et al., University Physics Volume 2 (2016) , https://openstax.org/books/university-physics-volume-2/pages/7-2-electric-potential-and-potential-difference [https://perma.cc/68EP-GSUN]. ↑
- See e.g., Heba Soffar, The Ammeter and Measuring the Electric Current Intensity, Electricity (Feb. 25, 2016),https://www.online-sciences.com/the-electricity/the-ammeter-and-measuring-the-electric-current-intensity [https://perma.cc/5U3B-SSKF]. ↑
- See, e.g., OHM’s Law … The Relationship Between Voltage, Current and Resistance, IAEI Mag. (Dec. 01, 2015), https://iaeimagazine.org/features/ohms-law-the-relationship-between-voltage-current-and-resistance [https://perma.cc/XG7B-XEJ9]. ↑
- Id. ↑
- Steven Ferrey, Inverting Choice of Law in the Wired Universe: Thermodynamics, Mass, and Energy, 45 Wm. & Mary L. Rev. 1839, 1909 (2004) [hereinafter Ferrey, Inverting Choice of Law]; Electric Potential Difference, Physics Classroom, https://www.physicsclassroom.com/class/circuits/Lesson-1/Electric-Potential-Difference [https://perma.cc/2EDB-MSDW]. ↑
- Id. ↑
- See generally U.S Dept. of the Interior, Transformers: Basics, Maintenance, and Diagnostics (2005), https://www.usbr.gov/tsc/techreferences/mands/mands-pdfs/Trnsfrmr.pdf [https://perma.cc/LMJ8-5PL5]. ↑
- See Electricity Explained, U.S. Energy Info. Admin. (Dec. 19, 2022), https://www.eia.gov/energyexplained/electricity/the-science-of-electricity.php [https://perma.cc/58D6-ZTLV] (declaring that electricity is the movement of electrons between atoms and that these electrons can be pushed out of their orbits); see also Van Valkenburgh, Basic Electricity 1–9 (rev. ed. 1992) (providing that the electron is negatively charged at a value equal to the positive charge of the proton, and electrons are weakly attracted to the atom and are easily forced away to neighboring atoms). ↑
- See Electricity Explained, supra note 147; see also Interview with Dr. Will Happer, Dep’t of Physics, Princeton Univ. (providing basis for the fact that, unless the wire is conducting current, there are just as many electrons going forward as backward in the wire, the electrons have frequent collisions with the other electrons and with atoms in the wire, and they transport no charge). When current flows through a wire to transmit power, there are slightly more electrons with velocities in the current direction than opposite it. Id. ↑
- Ferrey, Inverting Choice of Law, supra note 144, at 1910–11. ↑
- Id. at 1909. See Christopher S. Baird, What Is the Speed of Electricity?, Sci. Questions with Surprising Answers (Feb. 19, 2014), https://wtamu.edu/~cbaird/sq/2014/02/19/what-is-the-speed-of-electricity [https://perma.cc/C8AD-9BYU]. ↑
- See Ferrey, Inverting Choice of Law, supra note 144; see also Baird, supra note 150. ↑
- The kinetic energy of moving electrons is electron mass multiplied by velocity squared, then divided by two. Almost all of the electrical power is carried by the electric and magnetic fields that race down the wires at nearly the speed of light. Interview with Dr. Will Happer, supra note 148. ↑
- See Ferrey, Inverting Choice of Law, supra note 144, at 1909. ↑
- See Sharon Bertsch McGrayne, Electricity, Britannica, https://www.britannica.com/science/electricity [https://perma.cc/7A7B-ZTAP]. ↑
- Id. ↑
- Ferrey, Inverting Choice of Law, supra note 144, at 1910. ↑
- Interview with Dr. Will Happer, supra note 148 (discussing how the light and heat produced have exactly the same energy as has been transported into the device from the electromagnetic fields). ↑
- Valkenburgh, supra note 147, at 1–46 (stating that this potential difference is a “volt”). ↑
- Interview with Dr. Will Happer, supra note 148 (providing that electrical power is used for many purposes in a computer; the CPU is mounted on a heat sink that gets rid of waste heat to the circulating air). The secret for getting high-performance computers is getting the waste heat out fast enough. Id. ↑
- Id. (declaring that most of the electrons in food are so strongly attached to the atoms and molecules that they cannot speed up or slow down). The electric fields of a microwave oven heat up the food by pushing on the ions in the food. Id. ↑
- Id. (explaining that an incandescent lamp is a thin tungsten wire surrounded by an inert gas like argon and enclosed in a glass envelope to protect it from the air). If you flow a modest amount of current in the wire (half an amp), the wire ill heat to several thousand degrees and emit light, as well as infrared radiation that one can’t see. Id. ↑
- John M. Hughes, Practical Electronics: Components and Techniques 1–13 (2015) (detailing the role resistance plays in electrical networks). The light and heat produced have exactly the same energy as has been transported into the device from the electromagnetic fields. Id. The motion of the electrons in transmission lines or appliances is of minor significance compared to the energy transported by the fields. Id. ↑
- Ferrey, Inverting Choice of Law, supra note 144, at 1912. ↑
- Marcus Chown, What a Wonderful World: One Man’s Attempt to Explain the Big Stuff (2013) (quoting Dave Barry). ↑
- Hugh D. Young & Roger A. Freedman, University Physics 799 (9th ed. 1996). ↑
- Id. ↑
- Id. ↑
- Id. at 800. ↑
- Id. ↑
- Id. at 808. ↑
- Id. at 809. ↑
- Id. ↑
- Id. A joule is a unit of energy. A coulomb is a unit of charge. See The Editors of Encyclopaedia Britannica, Electromotive force, Britannica (Dec. 15, 2023), https://www.britannica.com/science/electromotive-force [https://perma.cc/5X99-5TY7]. ↑
- Young & Freedman, supra note 165, at 850. ↑
- Leslie C. Perelman et al., Section 15.8 – Useful Tables, Mayfield Elec. Handbook Tech. & Sci. Writing (Dec. 23, 2022), https://www.mit.edu/course/21/21.guide/use-tab.htm [https://perma.cc/H8GS-6FMP] (providing conversion metrics for watt as a joule per second in Table 3). ↑
- Id. ↑
- Watt-hour, supra note 113 (“A kilowatt-hour is a unit of energy equal to outputting one thousand watts for one hour.”). ↑
- Ferrey, Inverting Choice of Law, supra note 144, at 1913. ↑
- Electric and Magnetic Fields from Power Lines, EPA (Mar. 6, 2022), https://www.epa.gov/radtown/electric-and-magnetic-fields-power-lines [https://perma.cc/X9SC-JXA6]. ↑
- William J. Beaty, What Is “Electricity”?, Electrica Tech. Inc. (1996), http://amasci.com/miscon/whatis.html [https://perma.cc/4KYY-W8Z5] (noting that when electricity flows through a light bulb’s filament, it gets changed entirely into light). Yet not one bit of electricity is ever used up by the light bulb, and all the electricity flows out of the filament and back down the other wire. Id. See also Gareth Mitchell, How Fast Does Electricity Flow?, BBC Sci. Focus (Jan. 21, 2023), https://www.sciencefocus.com/science/how-fast-does-electricity-flow [https://perma.cc/3VPD-PY7B] (defining drift velocity as the average speed at which electrons travel in a conductor when subjected to an electric field at a rate of about one millimeter per second). ↑
- Beaty, supra note 180; William Harris & Craig Freudenrich, How Light Works, How Stuff Works (Mar. 6, 2021), https://science.howstuffworks.com/light9.htm [https://perma.cc/VQQ3-S7AZ]. ↑
- Ferrey, Inverting Choice of Law, supra note 144, at 1914. ↑
- Francisco Fernflores, The Equivalence of Mass and Energy, Stan. Encyc. of Phil. (Aug. 15, 2019), https://plato.stanford.edu/entries/equivME [https://perma.cc/5YNT-466P]. ↑
- Ferrey, Inverting Choice of Law, supra note 144, at 1914. ↑
- Bill Nussey, How Edison, Tesla, and Other Visionaries Invented the Modern Grid (Part 1 of 3), Freeing Energy (Apr. 20, 2018), https://www.freeingenergy.com/how-edison-tesla-and-other-visionaries-invented-the-modern-grid-part-1-of-3 [https://perma.cc/44LK-7HBP] (“On September 4, 1882, at 3 p.m., Edison turned on the generators at Pearl Street Station in Lower Manhattan and America’s first electric grid was born.”). ↑
- Id. ↑
- Mason Willrich, Electricity Transmission Policy for America: Enabling a Smart Grid, End to End, 22 Elec. J. 77, 77 (2009); see also Thomas J. King, In Praise of the Power Grid, U.S. Oak Ridge Nat’l Lab’y (July 27, 2016), https://www.ornl.gov/blog/praise-power-grid [https://perma.cc/5LBZ-WPQE]. ↑
- Nussey, supra note 185. ↑
- Energy Glossary, U.S. Energy Info. Admin. (Jan. 21, 2023), http://www.eia.doe.gov/glossary/glossary_e.htm [https://perma.cc/FLD3-RULB] (defining electric grid). ↑
- Steven Ferrey, Exit Strategy: State Legal Discretion to Environmentally Sculpt the Deregulated Environment, 26 Harv. Env’t L. Rev. 116, 118, 123 (2002). ↑
- See generally Steven Ferrey, Soft Paths, Hard Choices: Environmental Lessons in the Aftermath of California’s Electric Deregulation Debacle, 23 Va. Env’t L.J. 251 (2004). ↑
- See Robert Walton, NERC Sees Potential Summer Energy Shortfalls, Says Energy Transition “Pace” May Threaten Reliability, Util. Dive (May 27, 2021), https://www.utilitydive.com/news/nerc-sees-potential-summer-energy-shortfalls-says-energy-transition-pace/600878 [https://perma.cc/7R86-2JNB]. ↑
- See supra Sections III.A–B. ↑
- See supra Sections III.A, IV.B. ↑
- Justin Worland, The Texas Power Grid Failure Is a Climate Change Cautionary Tale, Time (Feb. 18, 2021), https://time.com/5940491/texas-power-outage-climate [https://perma.cc/NB86-JTCT]. ↑
- Sammy Roth, What Caused California’s Rolling Blackouts? Climate Change and Poor Planning, L.A. Times (Oct. 6, 2020), https://www.latimes.com/environment/story/2020-10-06/california-rolling-blackouts-climate-change-poor-planning [https://perma.cc/PD35-YKC4]. ↑
- Kristina Hamachi LaCommare & Joseph H. Eto, Cost of Power Interruptions to Electricity Consumers in the United States (U.S.), 31 Energy: Int’l J. 12 (2006), https://www.osti.gov/biblio/908489 [https://perma.cc/W3J9-53HE] (commenting on a U.S. Department of Energy study that published cost-of-reliability estimates ranging from $150 to $400 billion per year); Emily Walker, How Much Do Power Outages Cost?, EnergySage (May 31, 2022), https://www.energysage.com/energy-storage/how-much-do-power-outages-cost [https://perma.cc/G22N-5WBR] (reporting that the DOE estimated in 2015 that power outages cost businesses $150 billion annually); 2021 Report Card for America’s Infrastructure, Am. Soc’y of Civ. Eng’rs (Jan. 21, 2023), https://infrastructurereportcard.org/cat-item/energy-infrastructure [https://perma.cc/CQV5-CSSQ] (reporting that The Department of Energy found that power outages are costing the U.S. economy $28 billion to $169 billion annually). ↑
- See Amzi Haroun, What Happened During the 2003 California Recall Election – And Why It’s So Different than 2021, Bus. Insider (Sep. 13, 2021, 9:35 PM), https://www.businessinsider.com/what-happened-during-the-2003-california-recall-election-2021-9; see also Steven Ferrey, The Eagles of Deregulation: The Role of the Courts in a Restructured Environment, 32 Env’t L. 297 (2002); Ferrey, supra note 191. ↑
- Ann Deering, The Expanding Energy Crisis, 48 Risk Mgmt. 10, 13–14 (2001); see also Steven Ferrey, Power Future, 15 Duke Env’t L. & Pol’y F. 261, 277 (2005). ↑
- AUS Consultants, Impact of a Continuing Electricity Crisis on the California Economy, at ii (May 3, 2001); see also California Alliance for Energy & Economic Stability Study on the California Blackout (May 2001), www.caltox.org/member/digest/june2001/jun01-03.htm [https://perma.cc/E9RS-2SPK]; see also Ferrey, Power Future, supra note 199, at 277. ↑
- Virginia Ellis & Nancy Vogel, 8 State Power Contracts Seen as Bad Deals, L.A. Times (Sept. 30, 2001), https://www.latimes.com/archives/la-xpm-2001-sep-30-me-51694-story.html [https://perma.cc/C36W-QW4H]; see also Steven Ferrey, Electricity, Contract Rules, and the Environment: Welcome to the Hotel California, 31 Env’t L. Rep. 11475, 11479 (December 2001) [hereinafter Ferrey, Hotel California] ↑
- See Ferrey, Hotel California, supra note 201, at 11480. ↑
- See Asim Hussain, A Day Without Power: Outage Costs for Businesses, Bloom Energy (Oct. 8, 2019), https://www.bloomenergy.com/blog/a-day-without-power-outage-costs-for-businesses [https://perma.cc/WD67-TH4Z]; see also U.S. Dep’t of Energy, Strategic Plan for Distributed Energy Resources (2000), https://www.osti.gov/servlets/purl/777251 [https://perma.cc/6XQG-TQ66] [hereinafter U.S. Dep’t of Energy, Strategic Plan] (estimating that the value of a one-hour blackout to a brokerage firm is $8.5 million); Walker, supra note 197 (reporting that the DOE estimated in 2015 that power outages cost businesses $150 billion annually, including replacing spoiled food, emergency supplies, lost productivity, property damage, and alternative housing). ↑
- See U.S. Dep’t of Energy, Strategic Plan, supra note 203 (as quoted in R. Cowart et al., Nat’l Renewable Energy Lab’y, State Electricity Regulatory Policy and Distributed Resources: Distributed Resources and Electric System Reliability 10 (2002)); Hussain, supra note 203 (providing updated data on outage costs for businesses in 2019). ↑
- See James Barron, The Blackout of 2003: The Overview; Power Surge Blacks Out Northeast, Hitting Cities in 8 States and Canada; Midday Shutdowns Disrupt Millions, N.Y. Times (Aug. 15, 2003), https://www.nytimes.com/2003/08/15/nyregion/blackout-2003-overview-power-surge-blacks-northeast-hitting-cities-8-states.html [https://perma.cc/R45N-9JZ3]; see also JR Minkel, The 2003 Northeast Blackout–Five Years Later, Sci. Am. (Aug. 13, 2008), https://www.scientificamerican.com/article/2003-blackout-five-years-later [https://perma.cc/2L5Q-2PB6] (reflecting on the 2003 power outage). ↑
- U.S Sec’y of Energy & Minister of Nat. Res. Canada, Final Report on the August 14, 2003 Blackout in the United States and Canada: Causes and Recommendations 1 (2004), https://www3.epa.gov/region1/npdes/merrimackstation/pdfs/ar/AR-1165.pdf [https://perma.cc/9A7R-HYL4]. No real-time data on the system failure was available for more than three hours. Id. System operators were not adequately trained. Id. ↑
- See Barron, supra note 205 (reporting on the facts of the 2003 blackout). ↑
- Frank Graves & Lisa Wood, Economic Cost of the August 14th 2003 Northeast Power Outage: Preliminary Estimate (Aug. 18, 2003), https://www.brattle.com/wp-content/uploads/2017/10/6333_economic_cost_of_the_august_14th_2003_outage_graves_wood_aug_18_2003.pdf [https://perma.cc/659D-EXJF] (reporting on the costs of the 2003 blackout). The Brattle Group estimated that the August 2003 blackout cost businesses, alone $6 billion, with $75 million compensated by business insurance, given that less than 10 percent of U.S. businesses purchased “blackout” insurance. Id. See also Robert Little, Blackout Adds to Long List of Utilities Woes, Balt. Sun (Aug. 24, 2003), https://www.tribpub.com/gdpr/baltimoresun.com [perma.cc/7XW2-7LEA] (reporting that the blackout quickly incapacitated traffic lights, airports, trains, computer systems and air conditioners throughout a broad swath from the Midwest to the Atlantic Ocean). ↑
- See David Teather, Blackout Cost New York $36m an Hour, Guardian (Aug. 19, 2003), https://www.theguardian.com/business/2003/aug/20/usnews.internationalnews [https://perma.cc/5LMK-U6D3] (reporting that the blackout cost roughly $36 million an hour); see also Eric Herman et al., New Yorkers Return to Work as Officials Assess Cost to Blackout, Knight Ridder/Tribune News Serv. (Aug. 19, 2003). ↑
- Teather, supra note 209 (reporting that Michael Bloomberg estimated that the city would lose $40 million in tax revenues and pay out $10 million in overtime to police and other city workers). ↑
- See Associated Press, Blackout Damage Estimated To Be Near $6 Billion, Gainesville Sun (Aug. 20, 2003), https://www.gainesville.com/story/news/2003/08/20/blackout-damage-estimated-to-be-near-6-billion [https://perma.cc/5E9Q-NL49]. ↑
- See id. ↑
- Electricity Consumers Res. Council, U.S. Nuclear Reg. Comm’n, The Economic Impacts of the August 2003 Blackout (2004), https://www.nrc.gov/docs/ml1113/ml111300584.pdf [https://perma.cc/G3PU-R3NG] (providing that a study completed shortly after August 14, the Ohio Manufacturers’ Association (OMA) estimated the direct costs of the blackout on Ohio manufacturers to be $1.08 billion). ↑
- Jennifer Granholm, Blackout Exposed Vulnerability of Nation’s Electrical Power System, Roll Call (Sept. 19, 2003), https://rollcall.com/2003/09/19/blackout-exposed-vulnerability-of-nations-electrical-power-system [https://perma.cc/6T9L-Y8ZL]. ↑
- Id. ↑
- See Most Lights Back on in Cleveland, CNN (Aug. 15, 2003), https://edition.cnn.com/2003/US/08/15/blackout.cleveland/index.html [https://perma.cc/CA7F-SMPG]. ↑
- See id. (reporting on the four pumping stations and their backup systems serving Cleveland failure after the outage). ↑
- Reese Oxner & Juan Pablo Garnham, Over a Million Texans Are Still Without Drinking Water. Smaller Communities and Apartments Are Facing the Biggest Challenges, Tex. Trib. (Feb. 24, 2021, 6:00 PM), https://www.texastribune.org/2021/02/24/texas-water-winter-storm [https://perma.cc/2T7C-95AV]. ↑
- Peter Aldhous et al., The Texas Winter Storm and Power Outages Killed Hundreds More People than the State Says, Buzzfeed News (May 26, 2021, 6:09 PM), https://www.buzzfeednews.com/article/peteraldhous/texas-winter-storm-power-outage-death-toll [https://perma.cc/85LA-55RQ]; see also Barron, supra note 205. ↑
- See infra Part V. ↑
- See Hillary Aidun et al., Sabin Center for Climate Change L,. Colum. L. Sch., Opposition to Renewable Energy Facilities in the United States 2 (2022), https://scholarship.law.columbia.edu/cgi/viewcontent.cgi?article=1186&context=sabin_climate_change [https://perma.cc/WZ7F-UT8D]. ↑
- See Robert Bryce, Wind Projects Rejected in Nebraska and Ohio, Wind Rejections Across U.S. Now Total 328 Since 2015, Forbes (Apr. 29, 2022, 9:48 AM), https://www.forbes.com/sites/robertbryce/2022/04/29/wind-projects-rejected-in-nebraska-and-ohio-wind-rejections-across-us-now-total-328-since-2015/?sh=6bb2ffb13bab [https://perma.cc/7RBP-QGMV] [hereinafter Bryce, Wind Projects]. ↑
- Steven Ferrey, Flipped Constitutional Supremacy: Inferior Local Law Blocking Federal Policy, 2023 Utah L. Rev. 65, 96 (2023) [hereinafter Ferrey, Flipped Constitutional Supremacy]. ↑
- Steven Ferrey, Dislocating the Separation of Powers State ‘Thumb’ on The Biden Sustainability Initiatives & Law, Ariz. St. L.J. 755, 758 (2023) [hereinafter Ferrey, Dislocating the Separation of Powers]. ↑
- See Cities 101–Number of Local Governments, Nat’l League of Cities, https://www.nlc.org/resource/cities-101-number-of-local-governments [https://perma.cc/P6QT-DHZG] (“The most recent data from the U.S. Census Bureau (2012) counted 35,879 general purpose local governments, which includes 19,519 municipal governments, 16,360 town and township governments, and 3,031 county governments.”). ↑
- See Ferrey, Flipped Constitutional Supremacy, supra note 223; Ferrey, Dislocating the Separation of Powers, supra note 224. ↑
- See Ferrey, Flipped Constitutional Supremacy, supra note 223, at 84. ↑
- See Hannah Ritchie, How Does the Land Use of Different Electricity Sources Compare?, Our World in Data (June 16, 2022), https://ourworldindata.org/land-use-per-energy-source [https://perma.cc/TDQ3-BC9K]. ↑
- See Samantha Gross, Renewables, Land Use, and Local Opposition in the United States, Brookings (Jan. 2020), https://www.brookings.edu/wpcontent/uploads/2020/01/FP_20200113_renewables_land_use_local_opposition_gross.pdf [https://perma.cc/SG3J-5KPB] (writing about the land requirements of wind turbines). ↑
- Dustin Solberg, Wind’s Big Footprint: Clean Energy Still Needs Safeguards for Nature, Nature Conservancy (Nov. 29, 2017), https://blog.nature.org/2017/11/29/winds-big-footprint-clean-energy-still-needs-safeguards-for-nature [https://perma.cc/99XH-DM92]. ↑
- See Uma Outka, The Renewable Energy Footprint, 30 Stan. Env’t L.J. 241, 243 n.7 (2011) (quoting study by Robert McDonald et al.). Land required was biomass (134,270 acres), wind (17,810 acres), hydropower (13,334 acres), petroleum (11,048 acres), solar thermal (3,787 acres), coal (2,565 acres), geothermal (1, 847 acres), and nuclear power (585 acres). Id. ↑
- Vaclav Smil, Energies: An Illustrated Guide to the Biosphere and Civilization 15, 118 (1999). ↑
- See id. at 118–19. Animal dung also was burned in many traditional societies to supply heat energy. Id. ↑
- Center for Sustainable Systems, Wind Energy Factsheet, Univ. of Mich. (2021), https://css.umich.edu/publications/factsheets/energy/wind-energy-factsheet [https://perma.cc/Z83S-EALW]; Richard Bowers & Owen Comstock, 2020 Could be a Record Year for U.S. Wind Turbine Installations, U.S. Energy Info. Admin. (Nov. 12, 2020), https://www.eia.gov/todayinenergy/detail [https://perma.cc/KQ3H-Z8T3]. ↑
- See Steven Ferrey, The Law of Independent Power § 2:6, tbl.2.1 (rev. 2023). ↑
- What Is Capacity Factor and How Do Solar and Wind Energy Compare?, What Next Now, https://www.whatnextnow.com/home/solar/what-is-capacity-factor-and-how-does-solar-energy-compare [https://perma.cc/WH2H-TDQB] (showing solar capacity factors ranged between 10–25 percent, wind turbines 25 percent, hydroelectric power 40 percent, coal-fired power 70 percent, nuclear 89 percent); Natanael Bolson et al., Capacity Factors for Electrical Power Generation from Renewable and Nonrenewable Sources, PNAS (Dec. 20, 2022), https://www.pnas.org/doi/10.1073/pnas.2205429119 [https://perma.cc/Q477-LCWX] (1 W of fossil electricity generation capacity requires installation of 4 W solar photovoltaic panels or 2 W of wind power if replaced by solar or wind power because of their lower capacity factors.). ↑
- Solid Waste Agency of N. Cook Cnty. v. U.S. Army Corps of Eng’rs, 531 U.S. 159, 174 (2001). ↑
- Ecogen, LLC v. Town of Italy, 461 F. Supp. 2d 149, 157 (W.D.N.Y 2006) (citing Greene v. Town of Blooming Grove, 879 F.2d 1061, 1063 (2d Cir. 1989)); see also John R. Nolan, Historical Overview of the American Land Use Systems: A Diagnostic Approach to Evaluating Governmental Land Use Control, 23 Pace Env’t L. Rev. 821, 921–22 (2006). ↑
- Ecogen, 461 F. Supp. 2d at 156 (citing Heller v. Doe, 509 U.S. 312, 320 (1999)) (“In order to prevail on its substantive due process claim, Ecogen must establish that the Moratorium, at least insofar as it prohibits Ecogen’s construction of a substation, bears no rational relationship to any legitimate governmental purpose.”). ↑
- Fitzsimonds v. Bd. of Appeals of Chatham, 484 N.E.2d 113, 116 (Mass. 1985); see also Manning v. Bos. Redev. Auth., 509 N.E.2d 1173, 1179 (Mass. 1987) (holding “substantial deference” granted to local administrative agency’s interpretation of local zoning law). ↑
- Murr v. Wisconsin, 137 S. Ct. 1933 (2017) (imposing a three-factor test). ↑
- See Bryce, Wind Projects, supra note 222. Mount Joy Township supervisors rejected a plan for a 1,000-acre solar project proposed by Florida-based NextEra Energy Resources that would have been Pennsylvania’s largest solar project. Id. ↑
- Id. A permit for a 1,600-acre solar project was denied by the Butte-Silver Bow Zoning Board by a vote of 5-0. Id. ↑
- Id. A proposed 850-megawatt project that aimed to cover 14 square miles north of Las Vegas with solar panels was withdrawn. Id. ↑
- Id. Residents in Dane County are fighting the proposed 300-megawatt Koshkonong Solar Center. Id. ↑
- See Robert Bryce, Here’s the List of 317 Wind Energy Rejections the Sierra Club Doesn’t Want You To See, Forbes (Sept. 26, 2021), https://www.forbes.com/sites/robertbryce/2021/09/26/heres-the-list-of-317-wind-energy-rejections-the-sierra-club-doesnt-want-you-to-see [https://perma.cc/4SGE-PJLB] [hereinafter Bryce, Sierra Club]. ↑
- See Hillary Aidun & Jacob Elkin et al., Sabin Ctr. for Climate Change L., Opposition to Renewable Energy Facilities in the United States (2022). ↑
- Accord Pac. Gas & Elec. Co. v. State Energy Res. Conservation & Dev. Comm’n, 461 U.S. 190 (1983); see Va. Uranium, Inc. v. Warren, 139 S. Ct. 1894 (2019). ↑
- Accord Pac. Gas & Elec. Co., 461 U.S. 190; see Va. Uranium, 204 L. Ed. 2d 377. ↑
- Accord Pac. Gas & Elec. Co., 461 U.S. 190; see Va. Uranium, 204 L. Ed. 2d 377. ↑
- See Bryce, Sierra Club, supra note 246. ↑
- See President Biden’s Bipartisan Infrastructure Law, White House, https://www.whitehouse.gov/build [perma.cc/H4KH-4ZJU] [hereinafter Infrastructure Investment and Jobs Act]. ↑
- See id. (amending Federal Power Act § 216, 16 U.S.C. § 824p (2022)). ↑
- See Michael Wigmore et al., Feds May Need Power to Take State Lands for New Grid, LAW360 (Oct. 20, 2021), https://media.velaw.com/wp-content/uploads/2021/10/22104432/Feds-May-Need-Power-To-Take-State-Lands-For-New-Grid.pdf [https://perma.cc/7UKK-JP44] (“All but four of the lower 48 states, including every state east of the Mississippi River, have at least part of their boundaries defined by rivers.”). ↑
- See West Virginia v. Env’t Prot. Agency, 597 U.S. 697, 724, 2606 (2022). ↑
- Id. at 742 (quoting Nat’l Fed’n of Indep. Bus. v. Occupational Safety & Health Admin., 595 U. S. at 5 (Gorsuch, J., concurring)). ↑
- Id. at 719–35; see infra notes 260–263. ↑
- West Virginia, 597 U.S. at 724. ↑
- See Ferrey, Environmental Law, supra note 134, at 45. ↑
- See Panama Reining Co. v. Ryan, 293 U.S. 388, 430 (1935); A.L.A. Schecter Poultry Corp v. United States, 295 U.S. 495, 541–42 (1935). ↑
- See Ala. Ass’n of Realtors v. Dep’t of Health & Hum. Servs., 141 S. Ct. 2485 (2021). ↑
- West Virginia, 597 U.S. at 716 (quoting Util. Air Regul. Grp. v. Env’t Prot. Agency, 573 U.S. 302, 332 (2014)). ↑
- See Nat’l Fed. of Indep. Bus. v. Occupational Safety & Health Admin., 142 S. Ct. 661 (2022). ↑
- Id. ↑
- See supra notes 242–246. ↑
- See Int’l Energy Agency, World Energy Outlook Special Report: The Role of Critical Minerals in Clean Energy Transitions, 6 (2022) [hereinafter The Role of Critical Minerals in Clean Energy], https://iea.blob.core.windows.net/assets/ffd2a83b-8c30-4e9d-980a-52b6d9a86fdc/TheRoleofCriticalMineralsinCleanEnergyTransitions.pdf [https://perma.cc/7TCG-GYUH] (graphing the rapid deployment of clean energy technologies as part of energy transitions and implying a significant increase in demand for minerals). ↑
- Id. ↑
- Id. ↑
- See Mauldin, Turning Bullish on Energy, supra note 15. ↑
- See The Role of Critical Minerals in Clean Energy, supra note 266, at 13 (graphing the production of many energy transition minerals today, which is more geographically concentrated than that of oil or natural gas). ↑
- See The Role of Critical Minerals in Clean Energy, supra note 266. ↑
- Id. ↑
- See supra Section III.A. ↑
- See The Role of Critical Minerals in Clean Energy, supra note 266, at 11. ↑
- See The Role of Critical Minerals in Clean Energy, supra note 266 at 34 (graphing today’s recycling rates, which vary by metal depending on the ease of collection, price levels, and market maturity). ↑
- Id. at 39 (finding that continued investment is needed to manage new price cycles and volatility). ↑
- Id. ↑
- Id. ↑
- Lars Schernikau et al., Full Cost of Electricity ‘FCOE’ and Energy Returns ‘eROI’, J. Mgmt. & Sustainability 1, 5 (2022), https://papers.ssrn.com/sol3/papers.cfm?abstract_id=4000800 [https://perma.cc/4W3H-HXQG]. ↑
- Id. ↑
- See The Role of Critical Minerals in Clean Energy, supra note 266. ↑
- Id. at 198 (graphing how the emissions intensity of production can vary considerably across companies and regions). ↑
- The Role of Critical Minerals in Clean Energy, supra note 266; see Caitlin Purdy & Rodrigo Castillo, The Future of Mining in Latin America: Critical Minerals and the Global Energy Transition, Leveraging Transparency Reduce Corruption (2022), https://www.brookings.edu/wp-content/uploads/2022/07/GS07072022LTRC-Future-Mining-Latin-America.pdf [https://perma.cc/779C-HUSB]. ↑
- See Nat’l Renewable Energy Lab’y, Electrification Futures Study: Scenarios of Electric Technology Adoption and Power Consumption for the United States (2018); Robert Walton, EVs Could Drive 38% Rise in US Electricity Demand, DOE Lab Finds, Util. Dive (July 10, 2018), https://www.utilitydive.com/news/evs-could-drive-38-rise-in-us-electricity-demand-doe-lab-finds [https://perma.cc/78V4-J3S5] (“Rising electricity demand could lead to sustained absolute growth of 80 terawatt-hours per year, according to the U.S. Department of Energy’s National Renewable Energy Laboratory.”); Trieu Mai, Electrification Futures Study, Nat’l Renewable Energy Lab’y, https://www.nrel.gov/analysis/electrification-futures.html [https://perma.cc/8FG6-9TMJ]. ↑
- Savannah Bertrand, How the Inflation Reduction Act and Bipartisan Infrastructure Law Work Together to Advance Climate Action, Env’t & Energy Study Inst. (Sept. 12, 2022), https://www.eesi.org/articles/view/how-the-inflation-reduction-act-and-bipartisan-infrastructure-law-work-together-to-advance-climate-action [https://perma.cc/U79V-LMC9] (“Investments in the Inflation Reduction Act will help decarbonize the transportation sector, which accounts for 27 percent of U.S. greenhouse gas emissions.”); see Inventory of U.S. Emission Sources and Sinks, Env’t Prot. Agency (Aug. 25, 2023), https://www.epa.gov/ghgemissions/inventory-us-greenhouse-gas-emissions-and-sinks [https://perma.cc/R6X7-VJ7V]. ↑
- EIA Projects Nearly 50% Increase in World Energy Usage by 2050, Led by Growth in Asia, U.S. Energy Info. Admin. (Sept. 24, 2019), https://www.eia.gov/todayinenergy/detail [https://perma.cc/38BG-N2H4]. ↑
- Nichola Groom & Tina Bellon, EV Rollout Will Require Huge Investments in Strained U.S. Power Grids, Reuters (Mar. 5, 2021), https://www.reuters.com/article/us-usa-weather-grids-autos-insight/ev-rollout-will-require-huge-investments-in-strained-u-s-power-grids [https://perma.cc/KPD8-6UGM]. ↑
- Mauldin, supra note 15. ↑
- John Stossel, Electric Cars: Inconvenient Facts, Part One, YouTube (Nov. 1, 2022), https://www.youtube.com/watch?v=z2HneqfZGsM [https://perma.cc/JA45-Z842]; John Stossel, Video: Electric Cars: Inconvenient Facts, Part 2, YouTube (Nov. 15, 2022), https://www.youtube.com/watch?v=ptI6BRVC1Kw [https://perma.cc/7VFZ-8NDG]. ↑
- See Garrett Hering & J. Holzman, US Lithium-Ion Battery Imports Jump as China Seizes Market Share, S&P Glob. (Mar. 29, 2021), https://www.spglobal.com/marketintelligence/en/news-insights/latest-news-headlines/us-lithium-ion-battery-imports-jump-as-china-seizes-market-share-63271388 [https://perma.cc/UET9-AQZ3]. ↑
- Rare-earth minerals are a group of seventeen elements crucial for high-tech manufacturing. James Vincent, Rare Earth Elements Aren’t the Secret Weapon China Thinks They Are, Verge (May 23, 2019), https://www.theverge.com/2019/5/23/18637071/rare-earth-china-production-america-demand-trade-war-tariffs [https://perma.cc/EJ4R-Y2UR]. Lithium is produced in Australia, Chile, China, Argentina, Brazil, and Zimbabwe. Id. ↑
- Catherine Clifford, The ‘Land Grab’ for Lithium Is Just Getting Started with GM Deal, Says EV Materials Expert, CNBC (Jan. 31, 2023), https://www.cnbc.com/2023/01/31/land-grab-for-lithium-is-just-getting-started-with-gm-expert-says [https://perma.cc/9V3W-PPMX]. ↑
- The Role of Critical Minerals in Clean Energy, supra note 266, at 6, 26 (graphing that the rapid deployment of technologies as part of energy transitions implies a significant increase in demand for minerals). ↑
- Id. ↑
- See Allen McFarland, U.S. Energy Consumption in 2020 Increased for Renewables, Fell for All Other Fuels, U.S. Energy Info. Admin. (June 4, 2021), https://www.eia.gov/todayinenergy/detail.php?id=48236 [https://perma.cc/D6AS-5NMM] (detailing the decrease in U.S. energy consumption). “The industrial sector’s share of U.S. renewable consumption has fallen from about 30% to 20% in the last 15 years.” Id. “In 2020, U.S. energy consumption decreased in all four end-use sectors after accounting for electrical system energy losses.” Id. “Consumption decreased for all fuels compared with 2019 except renewable energy, which increased by 2%.” Id. “Petroleum consumption decreased 13%, natural gas decreased 2%, coal decreased 19%, and nuclear electric power decreased 2%.” Id. ↑
- Inflation Reduction Act, Pub. L. No. 117-169, 136 Stat. 1818 (2022). ↑
- See Mai, supra note 284. ↑
- See infra Sections III.A–B (discussing the Infrastructure Investment and Jobs Act and the Inflation Reduction Act). ↑
- Richard Martin, Fifty States Plan Charts a Path Away from Fossil Fuels, MIT Tech. Rev. (June 12, 2015), https://www.technologyreview.com/s/538451/fifty-states-plan-charts-a-path-away-from-fossil-fuels [https://perma.cc/U43W-4EH6]. ↑
- See generally Mark Z. Jacobson et al., Low-Cost Solution to the Grid Reliability Problem with 100% Penetration of Intermittent Wind, Water, and Solar for All Purposes, 112 Proc. Nat’l Acad. Sci. 15,060 (2015). ↑
- James Temple, Scientists Sharply Rebut Influential Renewable-Energy Plan, MIT Tech. Rev. (June 19, 2017), https://www.technologyreview.com/s/608126/in-sharp-rebuttal-scientists-squash-hopes-for-100-percent-renewables [https://perma.cc/Q97R-6RMH]. ↑
- Christopher T. M. Clack et al., Evaluation of a Proposal for Reliable Low-Cost Grid Power with 100% Wind, Water, and Solar, 114 Proc. Nat’l Acad. Sci. 6641, 6723 (2017); see also Temple, supra note 301 (recounting the rebuttal to and review of the Jacobson study as littered with miscalculations, underestimations, and unrealistic expectations). ↑
- Clack et al., supra note 302, at 6726–27 (positing that 100 percent renewable energy creates a myriad of problems for grid stability including: new grid architecture, load flow and transmission issues, and variability of loads from renewable energy sources). ↑
- Temple, supra note 301. Jacobson replied: “They don’t like the fact that we’re getting a lot of attention, so they’re trying to diminish our work.” Id. Jacobson stated: “There is not a single error in our paper.” Id. ↑
- Ellen M. Gilmer, Professor Drops Defamation Suit Over Dueling Energy Research, E&E News (Feb. 23, 2018), https://www.eenews.net/energywire/2018/02/23/stories/1060074571 [https://perma.cc/M7E3-6HTT]. ↑
- See supra notes 17–18. ↑
- See Kif Leswing, United States Could Be Completely Powered by Renewable Energy by 2050: Study, Futurism (Aug. 22, 2015), https://futurism.com/united-states-could-be-completely-powered-by-renewable-energy-by-2050-study [https://perma.cc/A2NX-3DMB]. ↑
- See generally Jacobsen et al., supra note 300. ↑
- See Off. of Energy Efficiency & Renewable Energy, supra note 6. ↑
- See What Is U.S. Electricity Generation by Energy Source?, U.S. Energy Info. Admin.: Frequently Asked Questions (2019), https://www.eia.gov/tools/faqs/faq.php?id=427&t=3 [https://perma.cc/Y7XG-NHUG]. ↑
- U.S. Energy Facts Explained, U.S. Energy Info. Admin. (June 10, 2022), https://www.eia.gov/energyexplained/us-energy-facts [https://perma.cc/JC2T-L6K7] (graphing U.S. primary energy consumption by energy source). ↑
- Electricity Market Report, Int’l Energy Agency (July 2021), https://www.iea.org/reports/electricity-market-report-july-2021 [https://perma.cc/V8D9-XPQX]. ↑
- Net Zero by 2050: A Roadmap for the Global Energy Sector, Int’l Energy Agency (May 2021), https://www.iea.org/reports/electricity-market-report-july-2021/executive-summary [https://perma.cc/5ZZR-S4TJ]. ↑
- Kathleen Spees et al., The Brattle Group, How States, Cities, and Customers Can Harness Competitive Markets to Meet Ambitious Carbon Goals 8 (2019), raabassociates.org/Articles/Spees-NRG%20Report%20on%20FCEM.pdf [https://perma.cc/JHC3-ED3L]. ↑
- See Jerusalem Demsas, Not Everyone Should Have a Say, Atlantic (Oct. 19, 2022), https://www.theatlantic.com/ideas/archive/2022/10/environmentalists-nimby-permitting-reform-nepa [https://perma.cc/ak54-paah]; see also Scott Patterson, The Professor Helping Guide Billions in Climate Spending, Wall St. J. (July 8, 2023), https://www.wsj.com/articles/the-professor-helping-guide-billions-in-climate-spending [https://perma.cc/E5EQ-8P7V] (noting a predicted increase in the use of fossil fuel-fired power plants if the IRA had not been enacted to do the opposite). ↑
- Patterson, supra note 315. ↑
- Jesse Jenkins et al., Repeat, Electricity Transmission Is Key to Unlock the Full Potential of the Inflation Reduction Act 4 (2022) https://repeatproject.org/docs/REPEAT_IRA_Transmission_2022-09-22.pdf [https://perma.cc/A463-D8VW]. ↑
- Id. at 11. ↑
- Id. at 12. ↑
- Id. at 4, 8. ↑
- Id. ↑
- Id. at 4. ↑
- Id. (Summary of Findings, fourth bullet point). ↑
- Douglas Kysar, It’s Time for Climate Change to Reach the International Court of Justice, Hill (Dec. 14, 2022), https://thehill.com/opinion/energy-environment/3774919-its-time-for-climate-change-to-reach-the-international-court-of-justice [https://perma.cc/DE7M-LNAG]. ↑
- See Steven Ferrey, Supreme Court Arrests Regulatory Law on Climate and Sustainable Power, 24 U. Pa. J. Const. L. 1096 (2022). ↑
- See infra Section IV.B.2. ↑
- Brian Kennedy et al., What the Data Says About Americans’ Views of Climate Change, Pew Rsch. Ctr. (Aug. 9, 2023), https://www.pewresearch.org/short-reads/2023/08/09/what-the-data-says-about-americans-views-of-climate-change [https://perma.cc/2SQK-WKUC] (“The U.S. is the second-largest carbon dioxide emitter, contributing about 13.5% of the global total.”). ↑
- 42 U.S.C. § 4332. ↑
- See Ferrey, Environmental Law, supra note 134, at 103. ↑
- See id. at 625, fig.9 (listing typical permits for a fossil-fueled power generation facility). See also Fact Sheet: New Source Review (NSR), EPA https://www.epa.gov/sites/default/files/2015-12/documents/nsrbasicsfactsheet103106.pdf [https://perma.cc/73BF-HJRB] (“[O]wners or operators obtain permits limiting air emissions before they begin construction. For that reason, NSR is commonly referred to as the ‘preconstruction air permitting program.’”). ↑
- See David Peterson, Link Between Growth in Economic Activity and Electricity Use Is Changing Around the World,U.S. Energy Info. Admin. (Nov. 20, 2017), https://www.eia.gov/todayinenergy/detail [https://perma.cc/7KJD-5DWS] (detailing how growth in economic activity, measured as gross domestic product, historically couples with increases in electricity use as populations grow and generate more goods and services); see also Steven Nadel, US Electricity Use Is No Longer Growing, Am. Council for an Energy-Efficient Econ. (Mar. 29, 2016), https://www.aceee.org/blog/2016/03/us-electricity-use-no-longer-growing [https://perma.cc/M4WM-NKXG] (“For many years, electricity use in the United States increased steadily, in lock-step with growth in the economy as measured by Gross Domestic Product (GDP).”). ↑
- See Cong. Rsch. Serv., R44854, 21st Century U.S. Energy Sources: A Primer 21 (2018), https://crsreports.congress.gov/product/pdf/R/R44854 [https://perma.cc/ZYX3-AM4D] (stating that lifecycle costs factor in and comparing the acquisition plus the operating costs of a technology over its entire useful life). ↑
- Id. (stating that EIA does not expect a “sustained return to the situation between 1975 and 1995, when the two growth measures were nearly equal in value, or the earlier period in which the growth rate in electricity use far exceeded the rate of economic growth”). ↑
- See Max Roser et al., World Population Growth, Our World In Data (Jan. 22, 2023), https://ourworldindata.org/population-growth [https://perma.cc/K3RG-9VFM] (estimating that a ~25 percent population increase multiplied by a ~20 percent per capita increase in electricity usage equals a ~50 percent electric power demand increase). After having risen from ~2 billion to ~8 billion in the past one hundred years, the United Nations forecasts that global population will rise further from currently ~8 billion to ~10 billion in the next twenty-five years. Id. Population could peak around 11–12 billion by the end of this century. Id. ↑
- See Energy Efficiency, Int’l Energy Agency, https://www.iea.org/energy-system/energy-efficiency-and-demand/energy-efficiency [https://perma.cc/2TYZ-MFRQ] (“Global energy intensity falls by around 4% per year on average this decade in the NZE Scenario, which compares with 1.7% over the last 10 years.”). ↑
- See Steven Ferrey, Broken at Both Ends: The Need to Reconnect Energy and Environment, 65 Syracuse L. Rev. 53 (2015); see also Electricity Markets – 101, Nat’l Governors Ass’n, https://www.nga.org/electricity-markets [https://perma.cc/P3LM-QYUF] (“[C]onsumers purchase electricity from the utility that services their area, which has an obligation to serve all customers in that area.”). ↑
- See West Virginia v. Env’t Prot. Agency, 597 U.S. 697 (2022). ↑
- See Maggie Molina, Renewables Are Getting Cheaper but Energy Efficiency, on Average, Still Costs Utilities Less, Am. Council for an Energy-Efficient Econ. (Dec. 18, 2018), https://www.aceee.org/blog/2018/12/renewables-are-getting-cheaper-energy [https://perma.cc/DP55-LK68] (proclaiming that energy efficiency, the kilowatt-hours avoided by eliminating waste, remains, on average, the United States’ least-cost resource); see also Energy Efficiency Impact Report, Am. Council for an Energy-Efficient Econ. (2022), https://energyefficiencyimpact.org [https://perma.cc/T9CW-EYA6] (describing energy efficiency as an energy resource that is distributed, zero-carbon, and often the most affordable option to satisfy energy needs relative to other generation technologies, even compared with wind and utility-scale solar); Annie Gilleo, Yes, Saving Energy Is Cheaper Than Making Energy, Am. Council for an Energy-Efficient Econ. (Jan. 27, 2016), https://www.aceee.org/blog/2016/01/yes-saving-energy-cheaper-making [https://perma.cc/86WM-X7PL] (noting that energy efficiency has remained consistent as the lowest-cost resource to meet customers’ energy needs); Energy Efficiency, Off. Energy Efficiency & Renewable Energy (Dec. 25, 2022), https://www.energy.gov/eere/energy-efficiency-buildings-and-industry [https://perma.cc/X3XZ-MCYL] (summarizing energy efficiency’s cost benefits). “Energy-efficient buildings cost less to heat, cool, and operate, while industry and manufacturing plants can make products at lower cost.” Id. Energy Efficiency: A Compelling Global Resource, McKinsey & Company (Mar. 2010), https://www.mckinsey.com/~/media/mckinsey/dotcom/client_service/sustainability/pdfs/a_compelling_global_resource.ashx [https://perma.cc/F5ZZ-7QRC] (supporting that energy efficiency could serve as an important bridge to an era of advanced low-carbon supply-side energy options). ↑
- See Arjun Makhijani, The Second Law of Thermodynamics, Inst. for Energy & Env’t Rsch. (Sept. 2012), https://ieer.org/resource/classroom/the-second-law-of-thermodynamics [https://perma.cc/4RB5-9GPZ]. ↑
- See Charlotte Cohn, The Cost of Saving Electricity for the Largest U.S. Utilities: Ratepayer-Funded Efficiency Programs in 2018, Am. Council for an Energy-Efficient Econ. (June 23, 2021), https://www.aceee.org/topic-brief/2021/06/cost-saving-electricity-largest-us-utilities-ratepayer-funded-efficiency [https://perma.cc/SJ3U-6K4G]. ↑
- See id. (analyzing the levelized cost of saved energy being even lower than in prior years because of utilities expanding their efficiency portfolios); Energy Efficiency Impact Report, supra note 338 (estimating that North American energy-efficiency investment levels increased by 15 percent from 2015 to 2022); Molina, supra note 338 (stating that energy efficiency, which is the kilowatt-hours we avoid by eliminating waste, remains on average the United States’ least-cost resource); see also Ben Somberg et al., Press Release: New Report Showcases the Far-Reaching Benefits of Energy Efficiency, Am. Council for an Energy-Efficient Econ. (Dec. 20, 2022), https://www.aceee.org/press-release/2022/12/new-report-showcases-far-reaching-benefits-energy-efficiency [https://perma.cc/U33Q-23UT] (reporting that efficiency investments since 1980 have reduced annual energy expenditures in the United States by nearly $800 billion and driven down energy consumption per household by 16 percent); Natalie Mims Frick, Still the One: New Study Finds Efficiency Remains a Cost-Effective Electricity Resource, Lawrence Berkeley Nat’l Labs (July 22, 2021), https://emp.lbl.gov/news/still-one-new-study-finds-efficiency-remains [https://perma.cc/9QLF-6N7Z] (confirming that the average cost of saving electricity is less than the cost of producing it). ↑
- See Clark W. Gellings et al., Efficient Use of Electricity, 263 Sci. Am. 64 (1990) (estimating that efficiency can increase by almost 30 percent at an average life-cycle cost of roughly 2.6 cents per kWh saved); Paul L. Joskow & Donald B. Marron, What Does a Negawatt Really Cost? Evidence from Utility Conservation Programs, 13 The Energy J. 41, 42 (1992), https://law2.suffolk.edu/library/ezproxy [https://www.jstor.org/stable/41322467] (presenting evidence suggesting that computations based on utility expectations could be underestimating the actual societal cost by a factor of two or more on average). ↑
- Ahmed Faruqui et al., Clouds in the Future of DSM, Electricity J., at 54, 58 (1994). ↑
- Id. at 62. ↑
- See Norland, Comprehensive Assessment of a Conservation and Load Reduction Program: Results of the General Public Utilities Case Study, in The Alliance to Save Energy, Utility and Private Sector Conservation Programs, Proceeding of the 1988 ACEEE Summer Study on Energy Efficiency in Buildings 6.166–6.176 (1988). ↑
- See Energy Efficiency Impact Report, supra note 338 (finding that the majority of states implementing energy efficiency resource standards have seen four times the energy savings compared to states without a standard). U.S. states accelerating their energy efficiency efforts include California, Massachusetts, New York, Vermont, Maine, District of Columbia, Maryland, New Jersey, Oregon, and Washington. Id. ↑
- See Ben Somberg et al., supra note 341 (quoting BCSE President Lisa Jacobson). The Energy Efficiency Impact Report outlines specific opportunities to further cost savings and emissions reduction through energy efficiency. Id. ↑
- See Steven Nadel & Lowell Ungar, Report U1907 – Halfway There: Energy Efficiency Can Cut Energy Use and Greenhouse Gas Emissions in Half by 2050, Am. Council for an Energy-Efficient Econ., at iv (Sept. 2019), https://www.aceee.org/sites/default/files/publications/researchreports/u1907.pdf [https://perma.cc/L422-8WUT] (concluding that energy efficiency can cut U.S. energy use and GHG emissions in half by 2050, getting the United States halfway to its climate goals). The energy efficiency opportunities examined could collectively reduce expected 2050 U.S. GHG emissions by about half, cut primary energy use by 49 percent, and reduce carbon dioxide (CO2) emissions by 57 percent. Id. at iv–v (describing energy efficiency as a win-win solution with a proven track record of reducing emissions, delivering energy savings, creating jobs, boosting grid resilience, reducing air pollution, and improving people’s health). See also Beatrice Marchi & Simone Zanoni, Supply Chain Management for Improved Energy Efficiency: Review and Opportunities, 10 Energies 1618, 1638 (Oct. 16, 2017), https://www.mdpi.com/1996-1073/10/10/1618 [https://perma.cc/M84K-LGCU] (“From the industrial user’s perspective, energy efficiency can result in great cost savings, improved competitiveness, profitability and quality, a better working environmental, etc.”); Brian Motherway et al., Accelerating Energy Efficiency: What Governments Can Do Now to Deliver Energy Savings, Int’l Energy Agency (Mar. 17, 2022), https://www.iea.org/commentaries/accelerating-energy-efficiency-what-governments-can-do-now-to-deliver-energy-savings [https://perma.cc/99HD-2Q3X] (“It is now very clear that energy efficiency can reduce fuel import dependence, lessen exposure to energy price volatility, and contribute to climate change mitigation, while making systems and societies more resilient.”). ↑
- U.S. Dept. of Energy, Increasing Efficiency of Building Systems and Technologies, in Quadrennial Technology Review: An Assessment of Energy Technologies and Research Opportunities, at figs. 5.8, 5.9, 5.14, 5.15 (2015). ↑
- See Capturing the Multiple Benefits of Energy Efficiency, Int’l Energy Agency (2014), https://iea.blob.core.windows.net/assets/28f84ed8-4101-4e95-ae51-9536b6436f14/Multiple_Benefits_of_Energy_Efficiency-148×199.pdf [https://perma.cc/8875-DM8V] (listing benefits of industrial energy efficiency). Energy efficiency benefits include the improved ability to engage supply chains by showing quantified benefits beyond cost reductions from reduced energy use. Id. at 134. See Bruce Lung et al., Multiple Benefits of Industrial Energy Efficiency – Lessons Learned and New Initiatives, Off. of Energy Efficiency & Renewable Energy (June 1, 2019), https://www.osti.gov/biblio/1531223 [https://perma.cc/NK72-UX9H] (concluding that industrial energy efficiency projects have multiple benefits in the range of 40–50 percent of the value of energy savings per measure or as much as 2.5 times the value of energy savings). Non-energy benefits include increased production and production reliability, improved product quality, increased equipment life, shorter process cycle time, and reduced raw materials use. Id. “Energy efficiency can also improve safety of the work environment, reduce maintenance and raw materials costs as well as costs of environmental compliance.” Id. “Because some energy-saving projects can provide better process control they can also improve reliability and raw material consumption, which would be important for process industries such as chemicals, petroleum refining and pulp & paper production.” Id. See Efficiency and Innovation in U.S. Manufacturing Energy Use, Nat’l Ass’n of Mfrs. (2014), https://www.energy.gov/sites/prod/files/2014/05/f15/energy-nam.pdf [https://perma.cc/2AF7-YZAZ] (presenting the role of energy efficiency in boosting productivity by providing greater control over the use of existing raw materials). “For example, energy efficient practices ensure that thermal resources are applied at the right temperature, for the right duration and in correct proportion to raw materials.” Id. at 9. “Companies like Ford Motor Company recognize energy efficiency’s potential to provide nonenergy benefits such as reduced raw material waste, reduced water consumption, reduced maintenance and repair, improved process cycle times and other equipment performance enhancements.” Id. at 11. See also Daniel R Simmons, Why Manufacturing Matters: Driving American Manufacturing Through Energy Innovation, Off. Energy Efficiency & Renewable Energy (Oct. 2, 2020), https://www.energy.gov/eere/articles/why-manufacturing-matters-driving-american-manufacturing-through-energy-innovation [https://perma.cc/T755-CKXR] (proclaiming that energy efficiency is critical to manufacturing competitiveness); The Role of Critical Minerals in Clean Energy, supra note 266 (presenting that investment in energy efficiency can significantly reduce the emissions footprint of mineral production in the near term). ↑
- See Int’l Energy Agency, Power Systems in Transition (2020), https://iea.blob.core.windows.net/assets/cd69028a-da78-4b47-b1bf-7520cdb20d70/Power_systems_in_transition.pdf [https://perma.cc/2XG2-CNAR] (“Variable renewables are more distributed than conventional generators.”). “Systems with distributed resources can be more resilient than centrali[z]ed systems, but require operators to have greater situation awareness.” Id. at 15. “Distributed resources can also be used to support recovery in a black system event and provide a basic level of supply to essential services in cases where towns are electrically ‘islanded’.” Id. at 33. See also David Roberts, Clean Energy Technologies Threaten to Overwhelm the Grid. Here’s How It Can Adapt., Vox (Nov. 11, 2019), https://www.vox.com/energy-and-environment/2018/11/30/17868620/renewable-energy-power-grid-architecture [https://perma.cc/J8KL-QFUV] (noting the rise of distributed energy resources, DERs that are small-scale energy resources often found “behind the meter,” on the customer side). “DERs can increasingly help smooth out the variations in demand and renewable energy production locally, without calling on distant power plants.” Id. Ebrahim P. Karan et al., Resilience Assessment of Centralized and Distributed Food Systems, Food Sec. 1, 59 (2022), https://link.springer.com/content/pdf [https://perma.cc/YBS3-YT58] (describing distributed systems as more resilient and less vulnerable to disruption); Nat’l Conf. on State Legislatures, Task Force On Energy Supply, Modernizing the Electric Grid: State Role and Policy Options (2019), https://www.ncsl.org/Portals/1/Documents/energy/Modernizing-the-Electri-Grid_112519_34226.pdf [https://perma.cc/7Y7K-PLJR] (“Technologies like distributed generation, demand response, energy efficiency and energy storage may provide lower-cost, lower-risk solutions that greatly reduce the risk of leaving consumers on the hook for stranded costs.”). “A small number of states are studying ways to value DERs based on their location and to deploy DERs at optimal locations and in ideal quantities to maximize their benefits to the grid and reduce utility customer costs.” Id. at 41. See also Five Required Characteristics of a Reliable Distributed System: An Analysis of Resource Sharing, Openness, Scalability, Concurrency and Fault Tolerance, Ivory Rsch. (Jan. 10, 2022), https://www.ivoryresearch.com/samples/five-required-characteristics-of-a-reliable-distributed-system-an-analysis-of-resource-sharing-openness-scalability-concurrency-and-fault-tolerance [https://perma.cc/5B7C-SF3Y] (listing five characteristics to a reliable distribution resource system). ↑
- See Morton J. Smith, Reliability, Availability, and Maintainability of Utility and Industrial Cogeneration Power Plants, 27 IEEE Transactions on Indus. Applications 669 (1991); Int’l Energy Agency, Unlocking the Potential of Distributed Energy Resources 1, 29 (2022), https://iea.blob.core.windows.net/assets/3520710c-c828-4001-911c-ae78b645ce67/UnlockingthePotentialofDERs_Powersystemopportunitiesandbestpractices.pdf [https://perma.cc/VAH3-WC8J] (including a RMI study showing that using battery storage paired with distributed PV for multiple services could improve its value proposition); Jonathan Flinn et al., DER Grid Impacts Analysis, Cal. Pub. Util. Comm’n (Feb. 1, 2020), https://www.cpuc.ca.gov/-/media/cpuc-website/divisions/office-of-governmental-affairs-division/reports/2020/der-grid-impacts-analysis-pu-code-9136-february-2020.pdf [https://perma.cc/YCB9-37VS] (presenting scenario showing extent of cost savings achieved if DERs were optimally placed); Prajjwal Gautam, Reliablity Studies of Distrubution System Integrated With Energy Storage, Univ. of Saskatchewan (Dec. 2018), https://core.ac.uk/download/pdf/226164517.pdf [https://perma.cc/U69N-8UBE] (concluding that a study’s results show that strategic deployment of energy storage systems in distribution systems helps improve the reliability of the worse-performing section and the overall system lowering the financial risk of Distribution System Operator under a reward/penalty structure based on performance-based regulation). ↑
- See Wendy Koch, Multimedia Project Highlights Efficiency’s Essential Role in a Clean Energy Future, Am. Council for an Energy-Efficient Econ. (Aug. 31 2022), https://www.aceee.org/blog-post/2022/08/multimedia-project-highlights-efficiencys-essential-role-clean-energy-future [https://perma.cc/LC85-XM8E] (noting that energy efficiency will receive its largest U.S. government investments ever from the Inflation Reduction Act of 2022); Local Energy Efficiency Benefits and Opportunities, EPA (July 13, 2022), https://www.epa.gov/statelocalenergy/local-energy-efficiency-benefits-and-opportunities [https://perma.cc/FC9Y-C54Q] (describing energy efficiency as one of the fastest, most cost-effective ways to save money, reduce GHG emissions, create jobs, and meet growing energy demand). ↑
- See Ferrey, Environmental Law, supra note 134; Bob Hinkle, Prioritizing Energy Efficiency to Combat the Climate Crisis, Util. Dive (Dec. 20, 2022), https://www.utilitydive.com/news/prioritizing-energy-efficiency-to-combat-the-climate-crisis [https://perma.cc/8JBG-N5JY] (explaining that energy efficiency is ready to deploy now with no complications with permitting or need to first build transmission lines); see also Energy Efficiency Policies and Programs, Off. State & Cmty. Energy Programs (Jan. 10, 2023), https://www.energy.gov/scep/slsc/energy-efficiency-policies-and-programs [https://perma.cc/GF2W-Q8SM] (declaring that zoning laws may be structured to encourage energy-efficient buildings); Monica Molina & Adam Riedel, NEPA Can Be Used as a Tool to Promote Energy Efficiency, Sabin Ctr. Climate Change L. at Colum. L. Sch. (July 10, 2012), https://blogs.law.columbia.edu/climatelawblogtest/2012/07/10/nepa-can-be-used-as-a-tool-to-promote-energy-efficiency [https://perma.cc/XNP2-WC7W] (arguing that energy efficiency, as a viable alternative to a proposed project or action in its entirety, presents fruitful commenting opportunity in the NEPA process and a potential avenue for challenging inadequate EISs through litigation). ↑
- See Frick, supra note 341 (confirming that the average cost of saving electricity is less than the cost of producing it). ↑
- Id. (finding that energy efficiency programs for utility customers are delivering significant savings at times when electricity needs are greatest—at lower cost). ↑
- See ESCO contracts, Int’l Energy Agency (Dec. 30, 2022), https://www.iea.org/reports/energy-service-companies-escos-2/esco-contracts [https://perma.cc/ADY7-PQRW] (explaining the shared savings model between the bank, client, and ESCO). “ESCO can provide financing, as well as project development and implementation costs, with the energy savings shared between the ESCO and the client over the contract period.” Id. See Nunzia Carbonara & Roberta Pellegrino, Public-Private Partnerships for Energy Efficiency Projects: A Win-Win Model to Choose the Energy Performance Contracting Structure, 170 J. Cleaner Prod. 1064 (Jan. 1, 2018), https://doi.org/10.1016/j.jclepro.2017.09.151 [https://perma.cc/5MAS-AL8L] (analyzing the collaboration between the public and private sectors that work jointly to reach shared or compatible objectives). “For energy efficiency projects delivered through [Public-Private Partnerships], the public sector uses private companies, the Energy Service Company (ESCO) to provide technical, commercial and financial services.” Id. at 1067. See also Nurcahyanto & Tania Urmee, Development of Energy Service Company (ESCO) Market to Promote Energy Efficiency Programmes in Developing Countries, in Transition Towards 100% Renewable Energy: Selected Papers from the World Renewable Energy Congress WREC 2017 ( Ali Sayigh ed.,2018), (arguing that energy service companies (ESCOs) can play a vital role in improving energy efficiency in developing countries, such as helping energy users, customers, companies, industries, and commercial sectors to improve an efficiency of equipment by providing energy service energy performance and/or credit risk); European Energy Efficiency Platform, Energy Service Companies (ESCos), Joint Rsch. Ctr. (Dec. 30, 2022), https://e3p.jrc.ec.europa.eu/node/190 [https://perma.cc/EYA2-YFJK] (providing information about ESCOs energy savings). ↑
- See supra Section V.A; Ferrey, Environmental Law, supra note 134. ↑
- See Mark Alan Hughes et al., Efficiency and Diversification: A Framework for Sustainably Transitioning to a Carbon-Neutral Economy, Kleinman Ctr. at Univ. Pa. (Sept. 18, 2020), https://kleinmanenergy.upenn.edu/wp-content/uploads/2020/11/EnergyEfficiencyandDiversification.pdf [https://perma.cc/MQH9-RAV2] (presenting a framework for adopting circular economy approaches to increasing energy efficiency and diversity while outlining exemplary projects in several cities). The fundamental basis for energy diversification is found in the very notion of “Carbon-neutral.” Id. at 18. Nat’l Sec. Strategy, White House 1, 33 (2022), https://www.whitehouse.gov/wp-content/uploads/2022/10/Biden-Harris-Administrations-National-Security-Strategy-10.2022.pdf [https://perma.cc/3YL5-V5M4] (listing the diversification and strengthening of the U.S. manufacturing supply chains and securing energy without reliance on fossil fuels as considerations part of the Oct. 2022 National Security Strategy). For example, the report notes the prioritization of funding projects that emphasize innovations that improve energy efficiency. Id. at 24. “There is a need to create and sustain stable future demand for these clean energy technologies, including energy efficiency, to motivate domestic supply chain investments.” Id. at 34. See also Why the Energy Mix of the Future Is Diversified, Vox (July 18, 2018), https://www.vox.com/ad/17587752/energy-industry-mix-green-environment-diversification [https://perma.cc/9GHQ-3MBY] (reporting that the diversification of U.S. energy mix to include an array of low-carbon resources—both renewable and not—helps build political independence, economic growth, and environmental protection). “An industry that diversifies like this becomes less dependent on outside suppliers, or single sources of fuel, which would otherwise make the country more vulnerable to market fluctuations and geopolitical crises.” Id. For example, “[i]n Atlanta, Georgia, and Birmingham, Alabama, Southern Company’s state-of-the-art Smart Neighborhoods are just one example of diversification ingenuity [with] [t]he Alabama neighborhood featur[ing] the Southeast’s first community-scale microgrid, made up of solar panels, battery storage, and a natural gas generator that function together to provide power.” Id. See also Int’l Renewable Energy Agency, Global Hydrogen Trade to Meet the 1.5°C Climate Goal: Part I – Trade Outlook for 2050 and Way Forward (2022), https://www.irena.org//media/Files/IRENA/Agency/Publication/2022/Jul/IRENA_ Global_hydrogen_trade_part_1_2022_.pdf [https://perma.cc/5NPS-GDRK] (stating that the diversified supply among various countries with a relatively close delivered cost highlights the benefit of renewable energy, which is ubiquitous, such as various countries being able to produce it at low cost, unlike the present situation with fossil fuels); Myah Ward, White House Is Pressed on Potential Oil Deals with Saudi Arabia, Venezuela and Iran, Politico (Mar. 7, 2022), https://www.politico.com/news/2022/03/07/white-house-oil-deals-saudi-arabia-venezuela-iran [https://perma.cc/H5BB-RCFN] (reporting on the Biden Administration’s willingness to cut oil deals with countries like Saudi Arabia, Iran, and Venezuela). ↑
- See Energy Efficiency, Off. of Energy Efficiency & Renewable Energy, supra note 338 (stating that energy efficiency saves money for the consumer and contributes to an equitable transition to a decarbonized energy system by 2050); Majority of New Renewables Undercut Cheapest Fossil Fuel on Cost, Int’l Renewable Energy Agency (June 22, 2021), https://www.irena.org/news/pressreleases/2021/Jun/Majority-of-New-Renewables-Undercut-Cheapest-Fossil-Fuel-on-Cost [https://perma.cc/P4GE-LRB3] (reporting that renewable energy achieves lower costs than the most competitive fossil fuel option). IRENA’s Director-General Francesco La Camera said that “renewables are the cheapest source of power.” Id. ↑
- See FACT SHEET: How the Inflation Reduction Act Will Help Small Businesses, White House (Sept. 12, 2022),https://www.whitehouse.gov/briefing-room/statements-releases/2022/09/12/fact-sheet-how-the-inflation-reduction-act-will-help-small-businesses [https://perma.cc/4NWN-SC7Y] (providing examples of the IRA’s efficiency tax credits and grants). “Small business building owners can receive a tax credit up to $5 per square foot to support energy efficiency improvements that deliver lower utility bills.” Id. “The Act significantly expands the Rural Energy for America Program, which supports rural small businesses and agricultural producers with clean energy and energy efficiency upgrades.” Id. See also Green Power Partnership, The Inflation Reduction Act, EPA (Nov. 21, 2022), https://www.epa.gov/green-power-markets/summary-inflation-reduction-act-provisions-related-renewable-energy [https://perma.cc/TK2G-UZZ7] (listing that the IRA will provide new tax benefits to tax-exempt organizations by enabling some nonprofits to transfer the tax break to contractors and offering new access to tax credits and grants to reduce air pollution, with an emphasis on reaching disadvantaged populations, environmental justice, and other communities); Courtney Lindwall, A Consumer Guide to the Inflation Reduction Act, Nat’l Res. Def. Council (Oct. 24, 2022), https://www.nrdc.org/stories/consumer-guide-inflation-reduction-act [https://perma.cc/UPD2-RDWP] (commenting on how to take advantage of the rebate programs for energy-efficiency upgrades); Nat’l Conf. State Legislatures Staff, Inflation Reduction Act of 2022 Provisions (2022), https://www.ncsl.org/Portals/1/Documents/NCSL/NCSL-Summary-Inflation-Reduction-Act.pdf [https://perma.cc/YJK9-VZRH] (highlighting the IRA’s energy efficiency aspects). The IRA provides incentives for energy efficiency improvements for residential and commercial properties, including generation and transmission assets. Id. ↑
- See Energy Funding in the Infrastructure Investment and Jobs Act, U.S. Chamber Commerce. (Jan. 21, 2022), https://www.uschamber.com/infrastructure/energy-funding-in-the-infrastructure-investment-and-jobs-act [https://perma.cc/6KSZ-66M6]. ↑
- John Bestine, EPRI, Presentation at the IRA Symposium: Resources for the Future (Feb. 15, 2023) (on file with author). ↑
- Katie Brigham, Why the Electric Vehicle Boom Could Put a Major Strain on the U.S. Power Grid, CNBC (July 1, 2023, 9:00 AM), https://www.cnbc.com/2023/07/01/why-the-ev-boom-could-put-a-major-strain-on-our-power-grid.html [https://perma.cc/X6ZW-D5QH]. ↑
- See Off. of Energy Efficiency & Renewable Energy, supra note 6 (stating that renewable energy generates about 20 percent of all U.S. electricity, and that percentage continues to grow). ↑
- 16 U.S.C. §§ 824a–e. ↑
- Jim Rossi, The Common Law “Duty to Serve” and Protection of Consumers in an Age of Competitive Retail Public Utility Restructuring, 51 Vand. L. Rev. 1233, 1236–39 (1998). ↑
- Id. at 1236. ↑
- See supra notes 357, 361. ↑
- See Energy Efficiency: The First Fuel and the Long-Term Solution to the Current Energy Crisis, UNECE (Oct. 5, 2022), https://unece.org/sustainable-development/news/energy-efficiency-first-fuel-and-long-term-solution-current-energy [https://perma.cc/FMT2-CTQR] (describing energy efficiency as the “first fuel,” inexpensive, abundant, and the “key to achieving systems resilience and to enhancing industrial performance”); Energy Efficiency, Off. of Energy Efficiency & Renewable Energy, supra note 338 (promoting energy efficiency across all sectors of the U.S. economy); Local Energy Efficiency Benefits and Opportunities, EPA (July 13, 2022), https://www.epa.gov/statelocalenergy/local-energy-efficiency-benefits-and-opportunities [https://perma.cc/FC9Y-C54Q] (listing the benefits of energy efficiency, including environmental, economic, utility system, risk management, and local opportunities to improve energy efficiency). “Increased efficiency can lower greenhouse gas (GHG) emissions and other pollutants, as well as decrease water use.” Id. “Improving energy efficiency can lower individual utility bills, create jobs, and help stabilize electricity prices and volatility.” Id. “Energy efficiency can provide long-term benefits by lowering overall electricity demand, thus reducing the need to invest in new electricity generation and transmission infrastructure.” Id. “Energy efficiency also helps diversify utility resource portfolios and can be a hedge against uncertainty associated with fluctuating fuel prices.” Id. See also Energy Efficiency, Energy Star (Jan. 10, 2023), https://www.energystar.gov/about/how_energy_star_protects_environment/energy_efficiency [https://perma.cc/3ZSJ-6K9D] (describing energy efficiency as “one of the most cost-effective ways to combat climate change, clean the air we breathe, help families meet their budgets, and help businesses improve their bottom lines”). “By using energy more efficiently, we can help reduce emissions of greenhouse gases and other air pollution, fight the threat of climate change, and help to protect our health and the environment.” Id. ↑
- See supra notes 348, 351–352. ↑
- Id. ↑
- Guterres, supra note 31. ↑
- See generally Steven Ferrey, Unlocking the Global Warming Toolbox: Key Choices for Carbon Restriction and Sequestration (2010). ↑